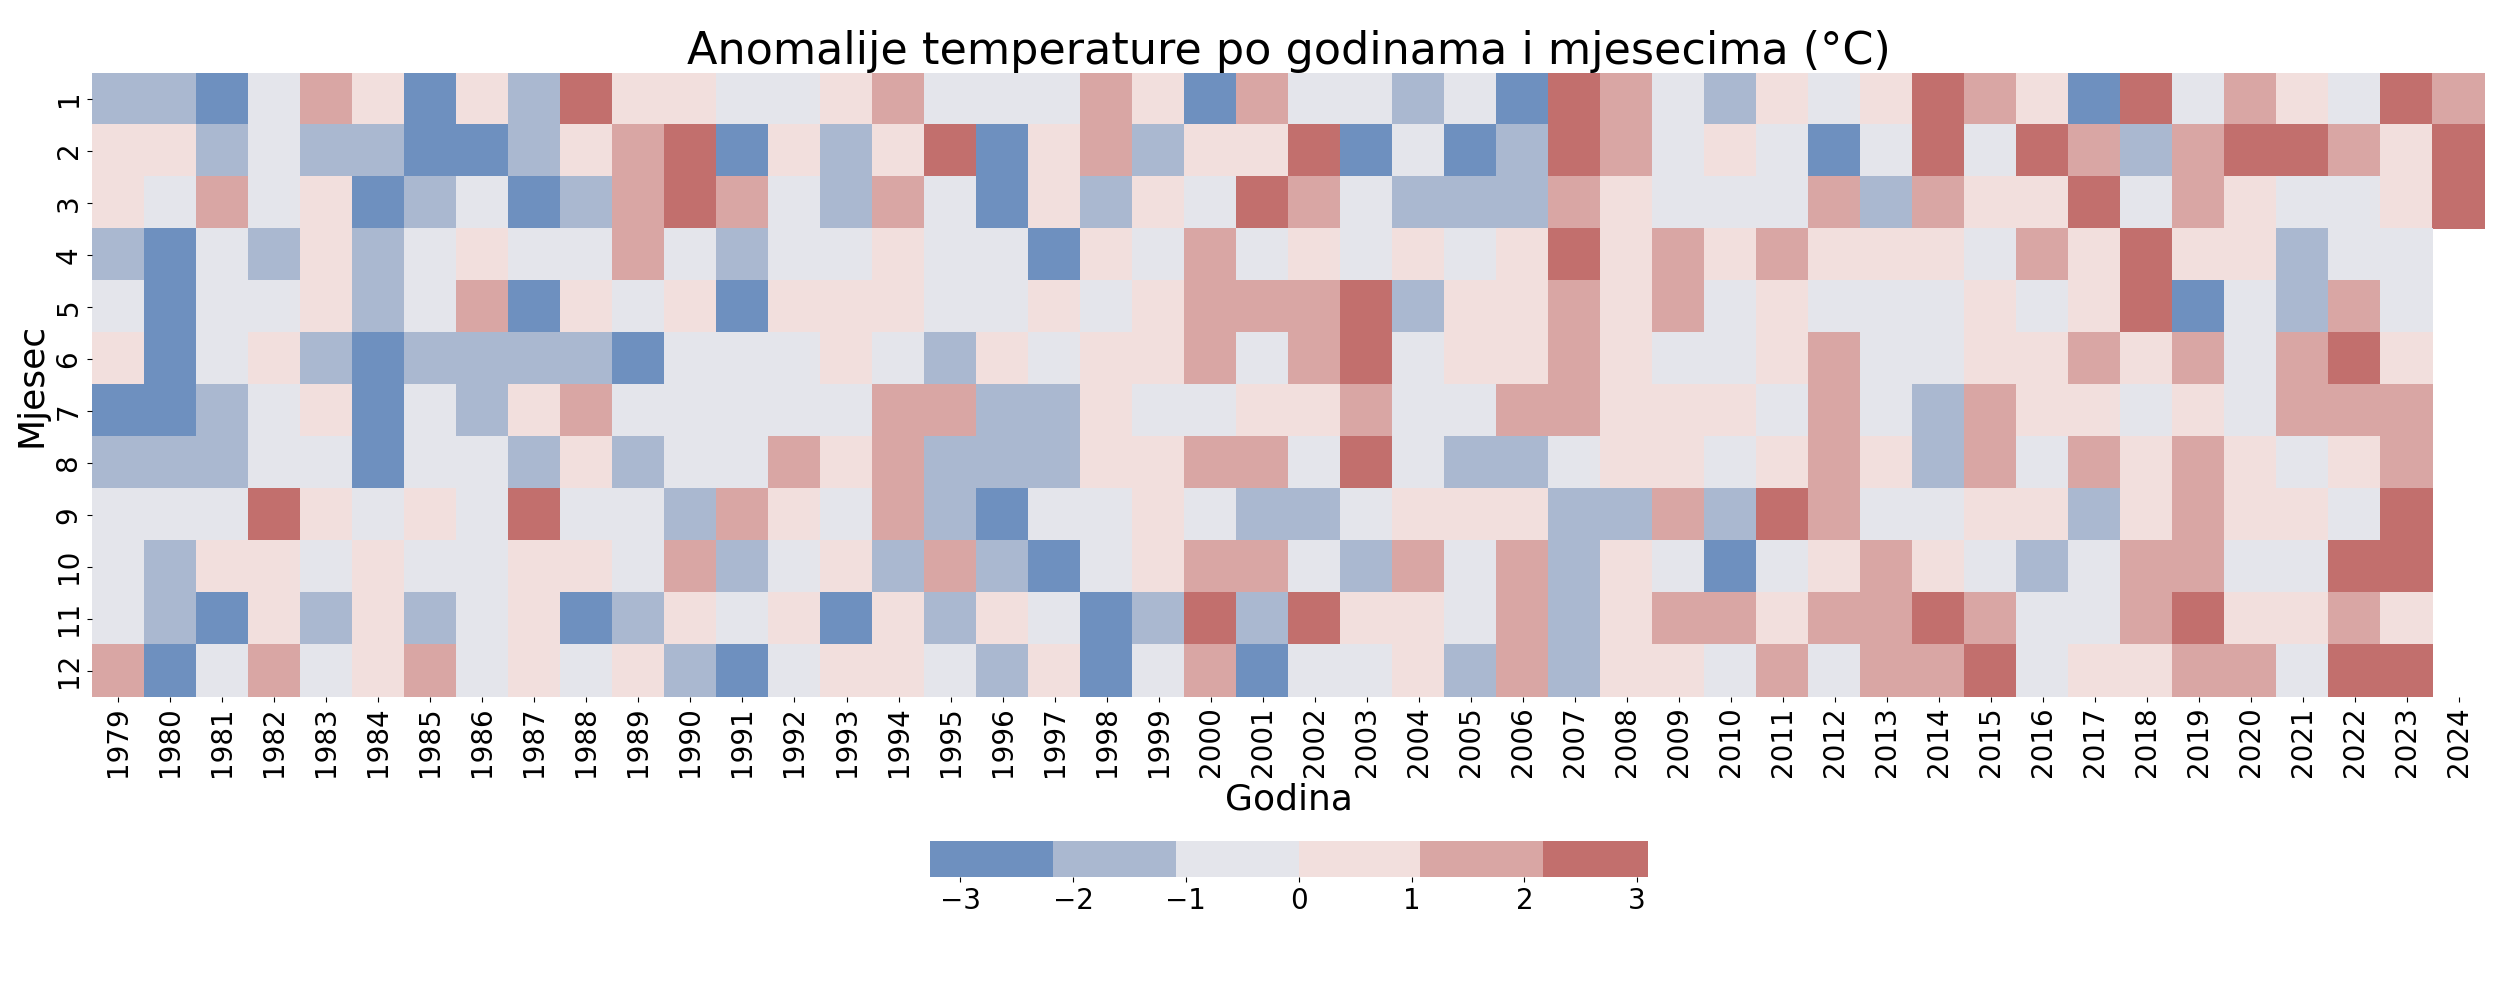
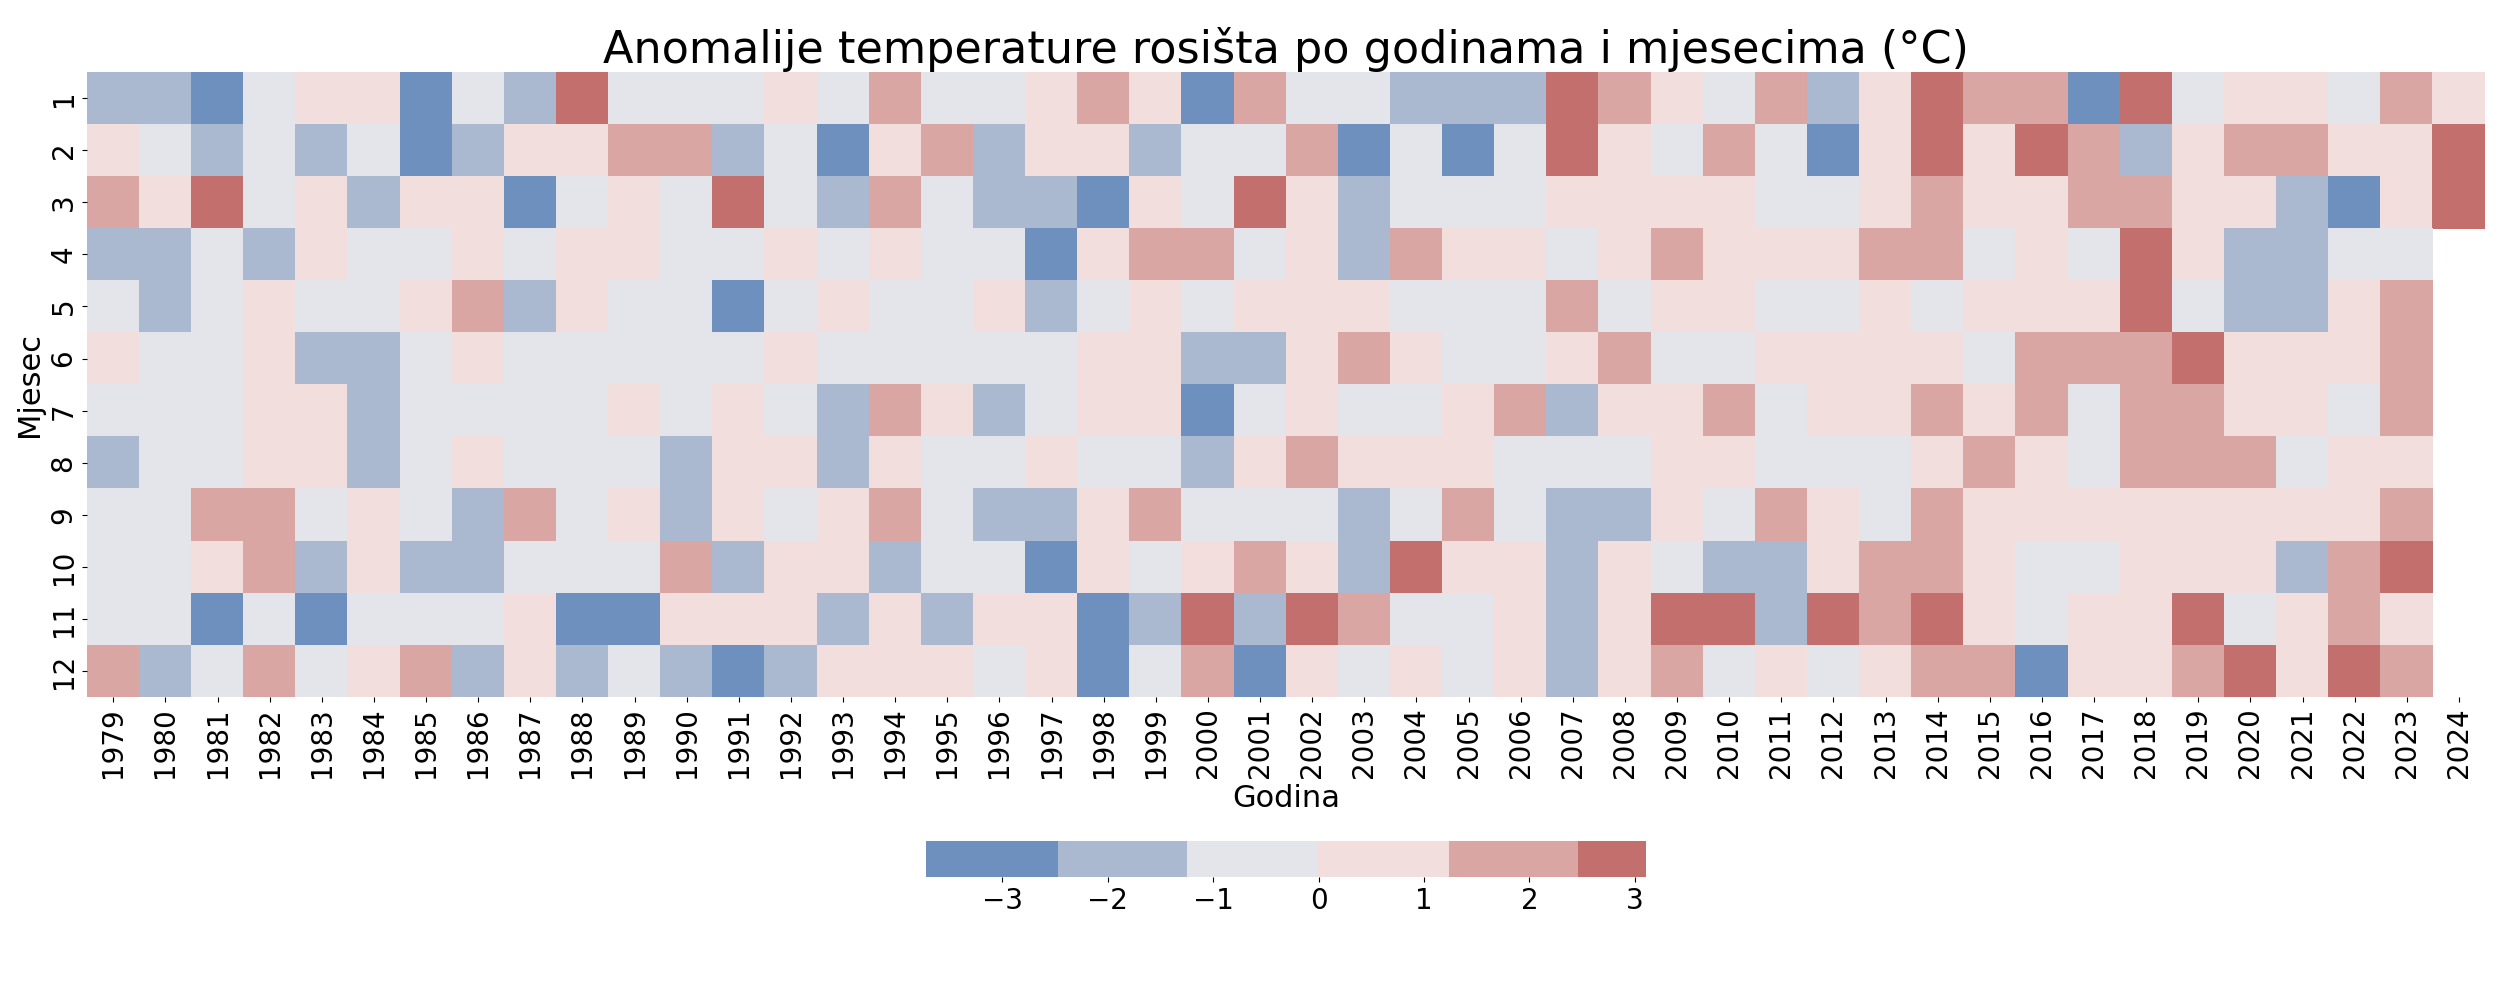
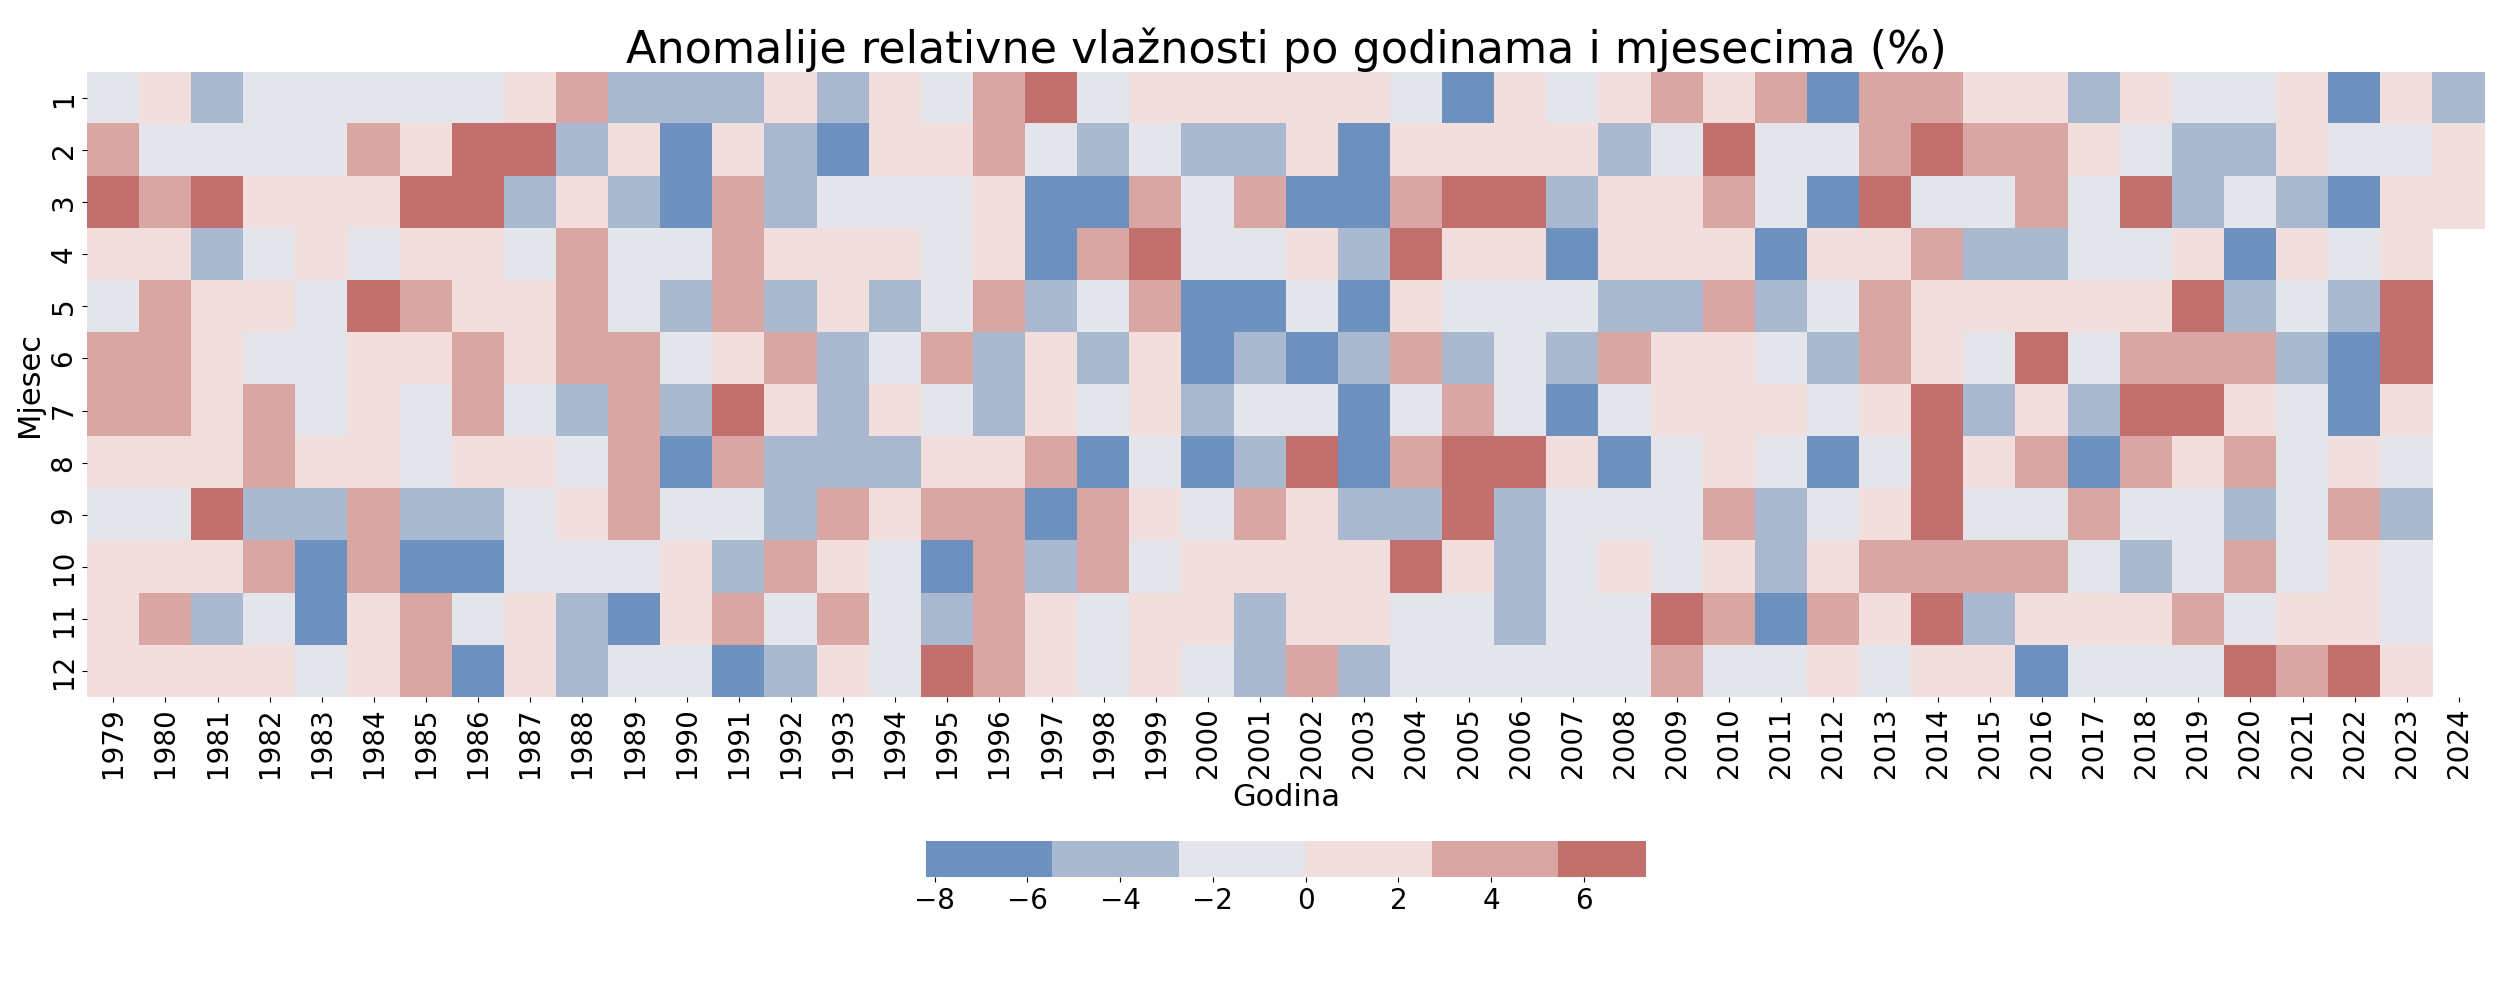
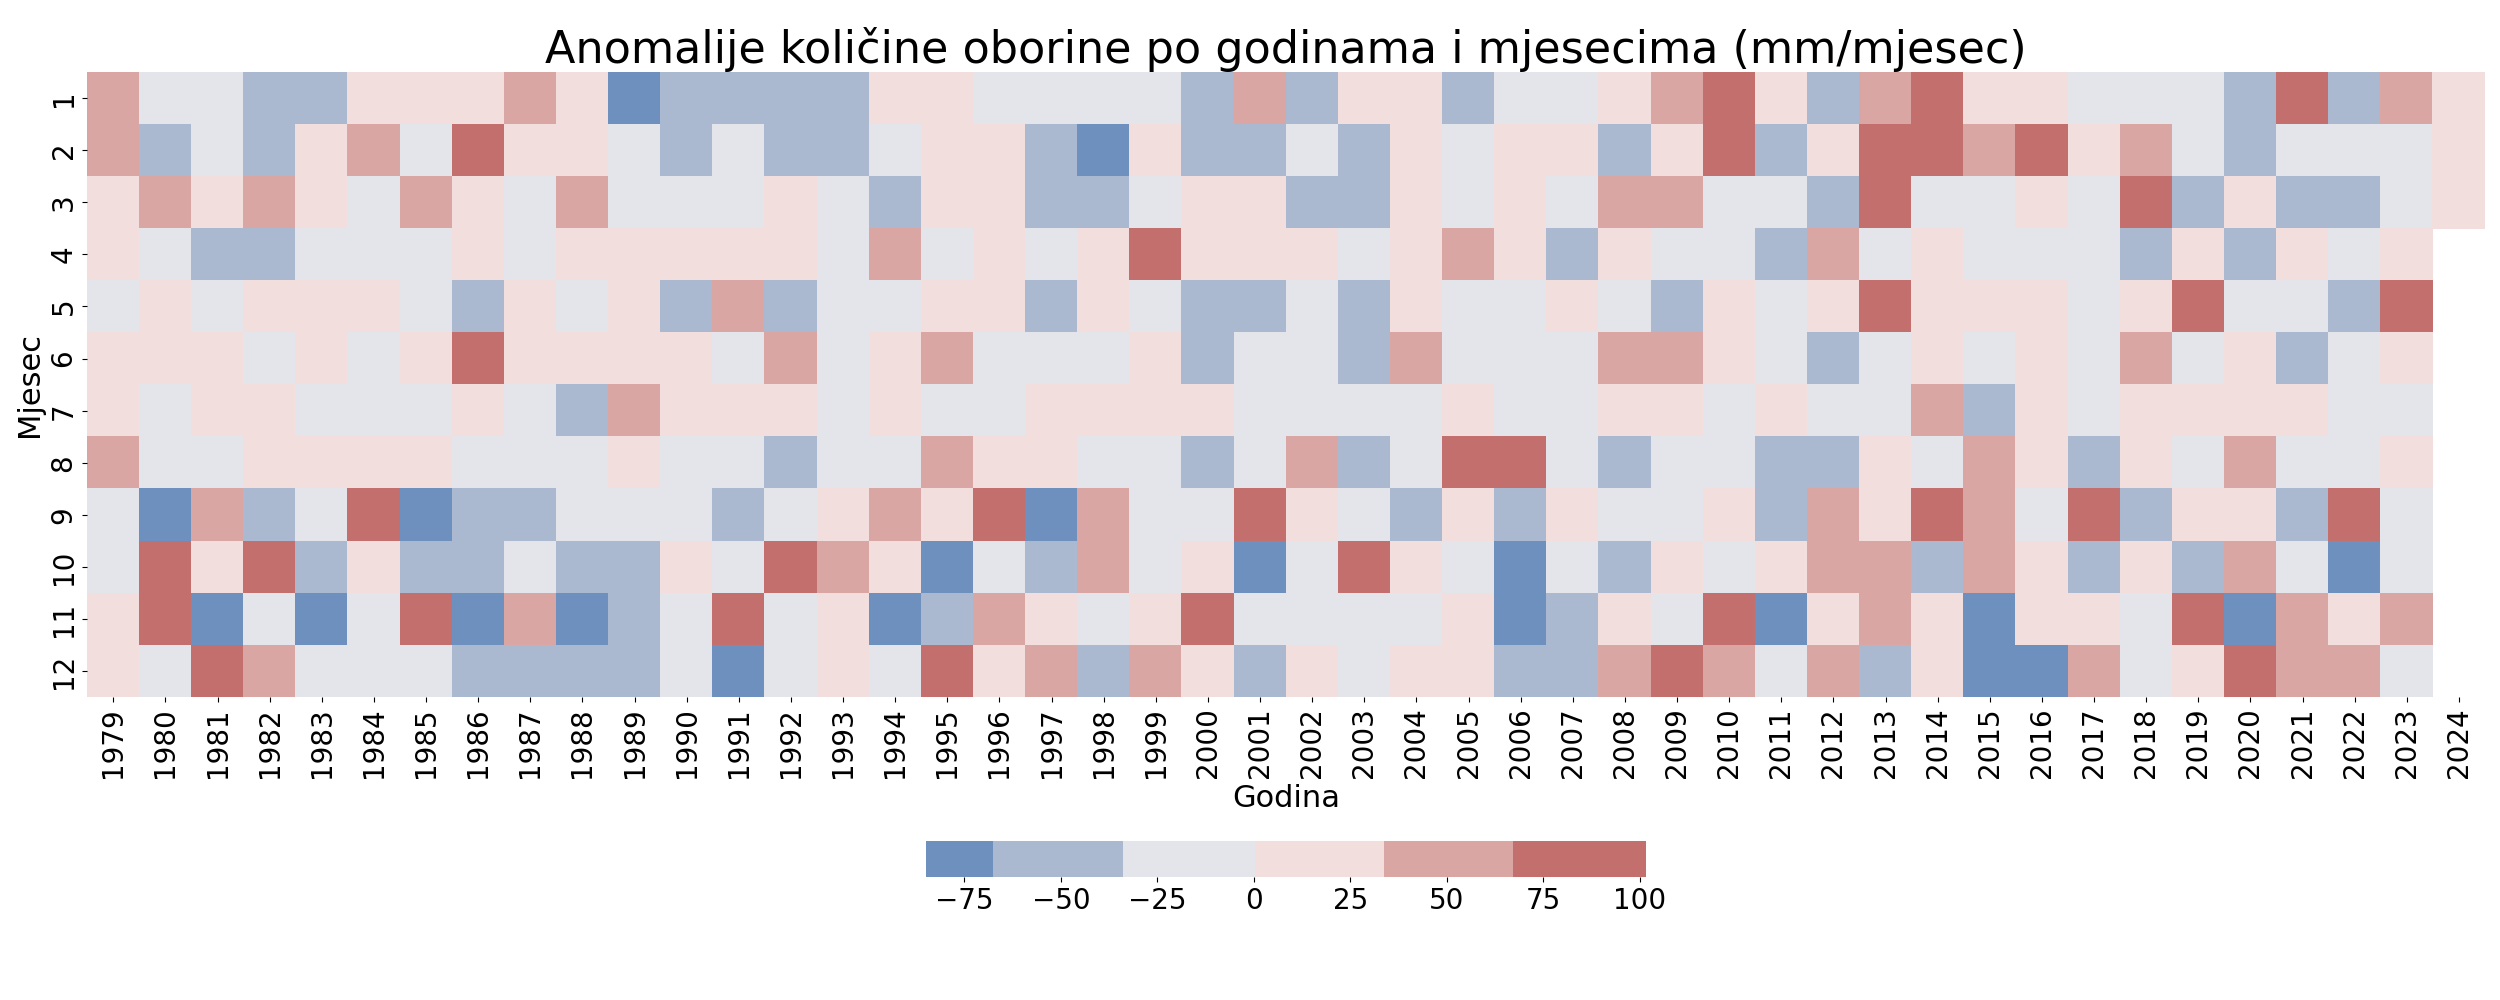
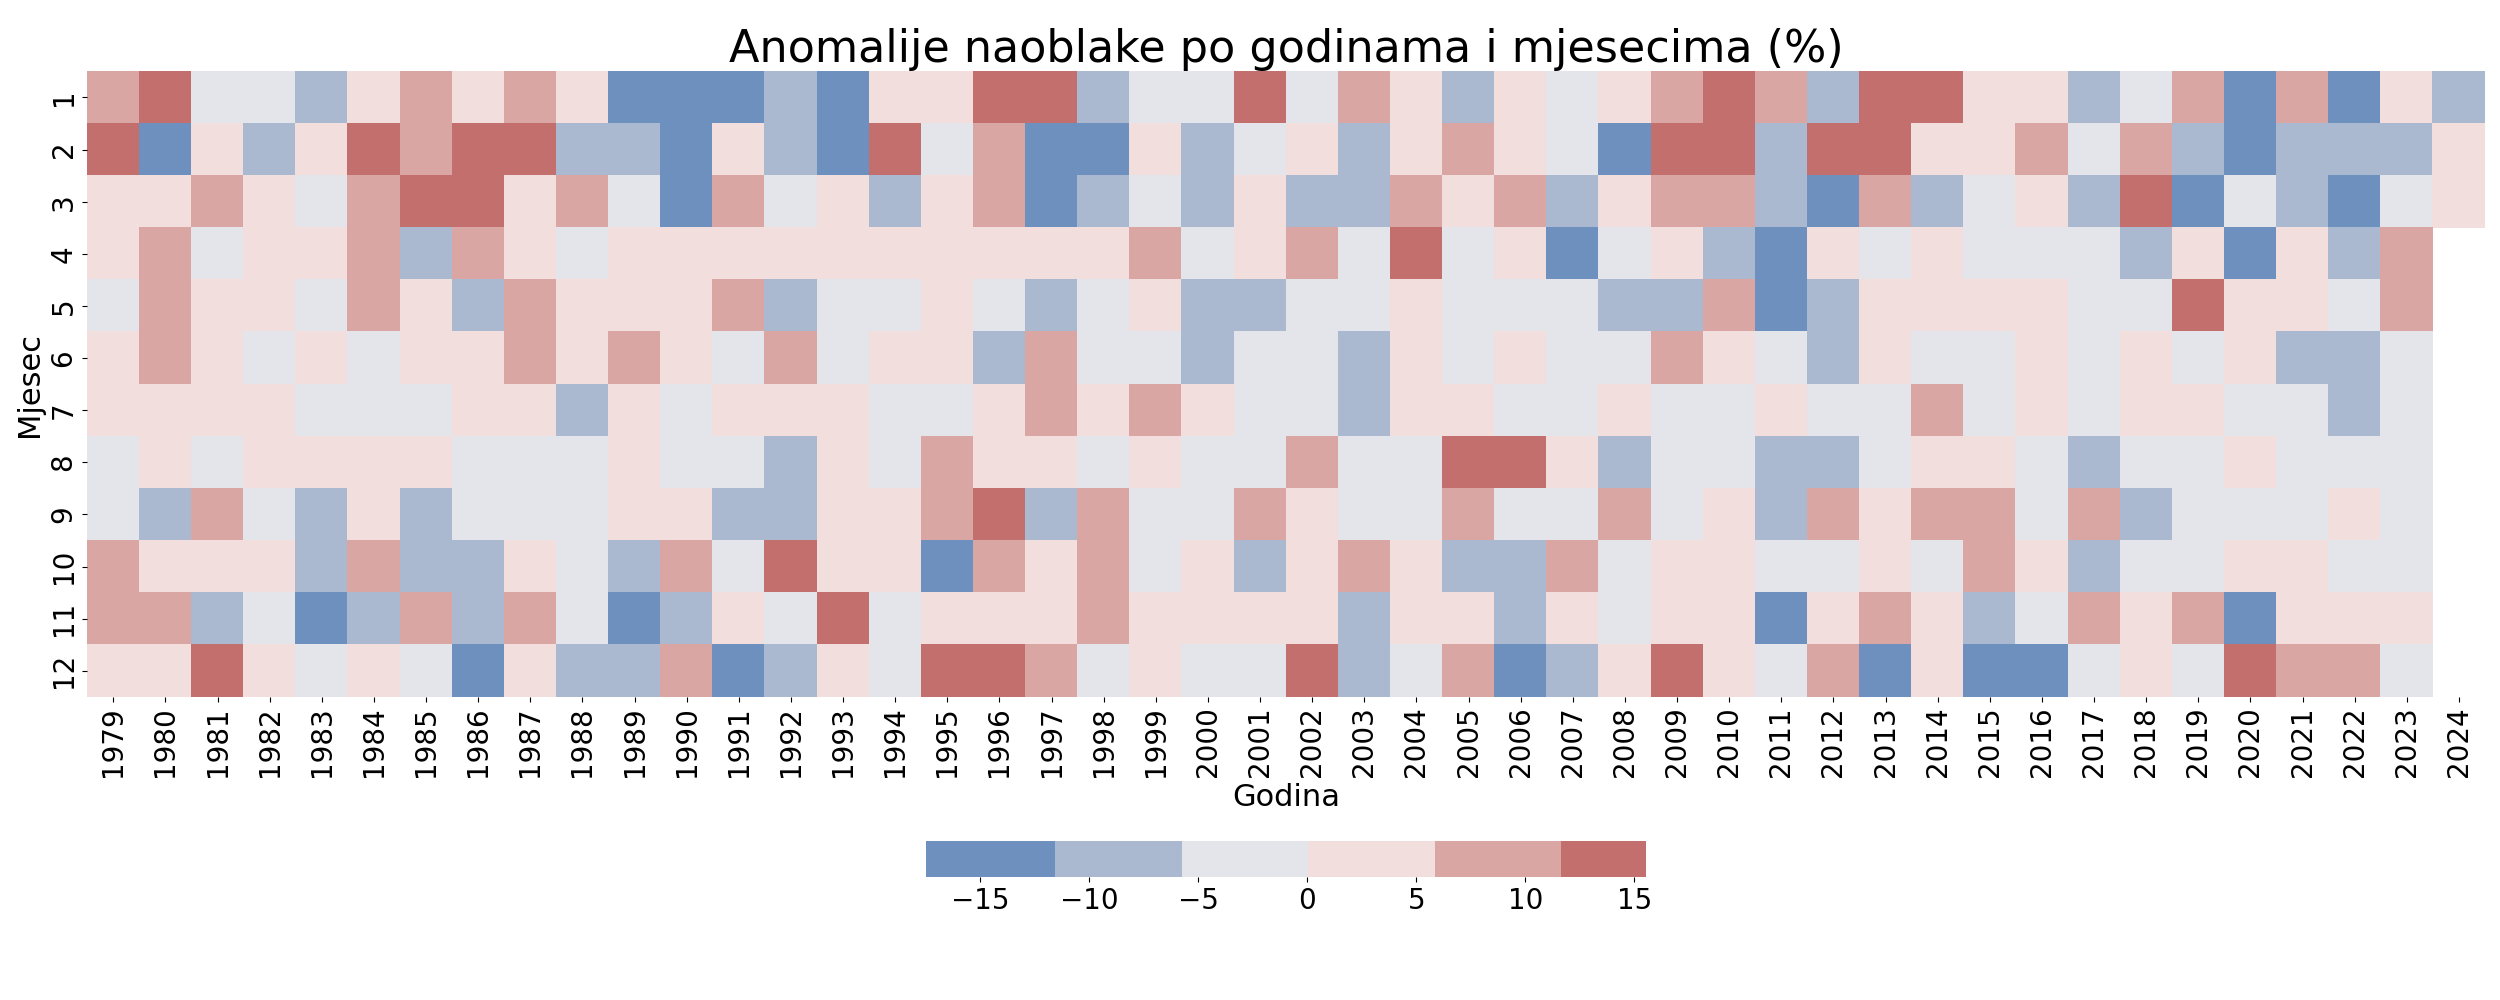
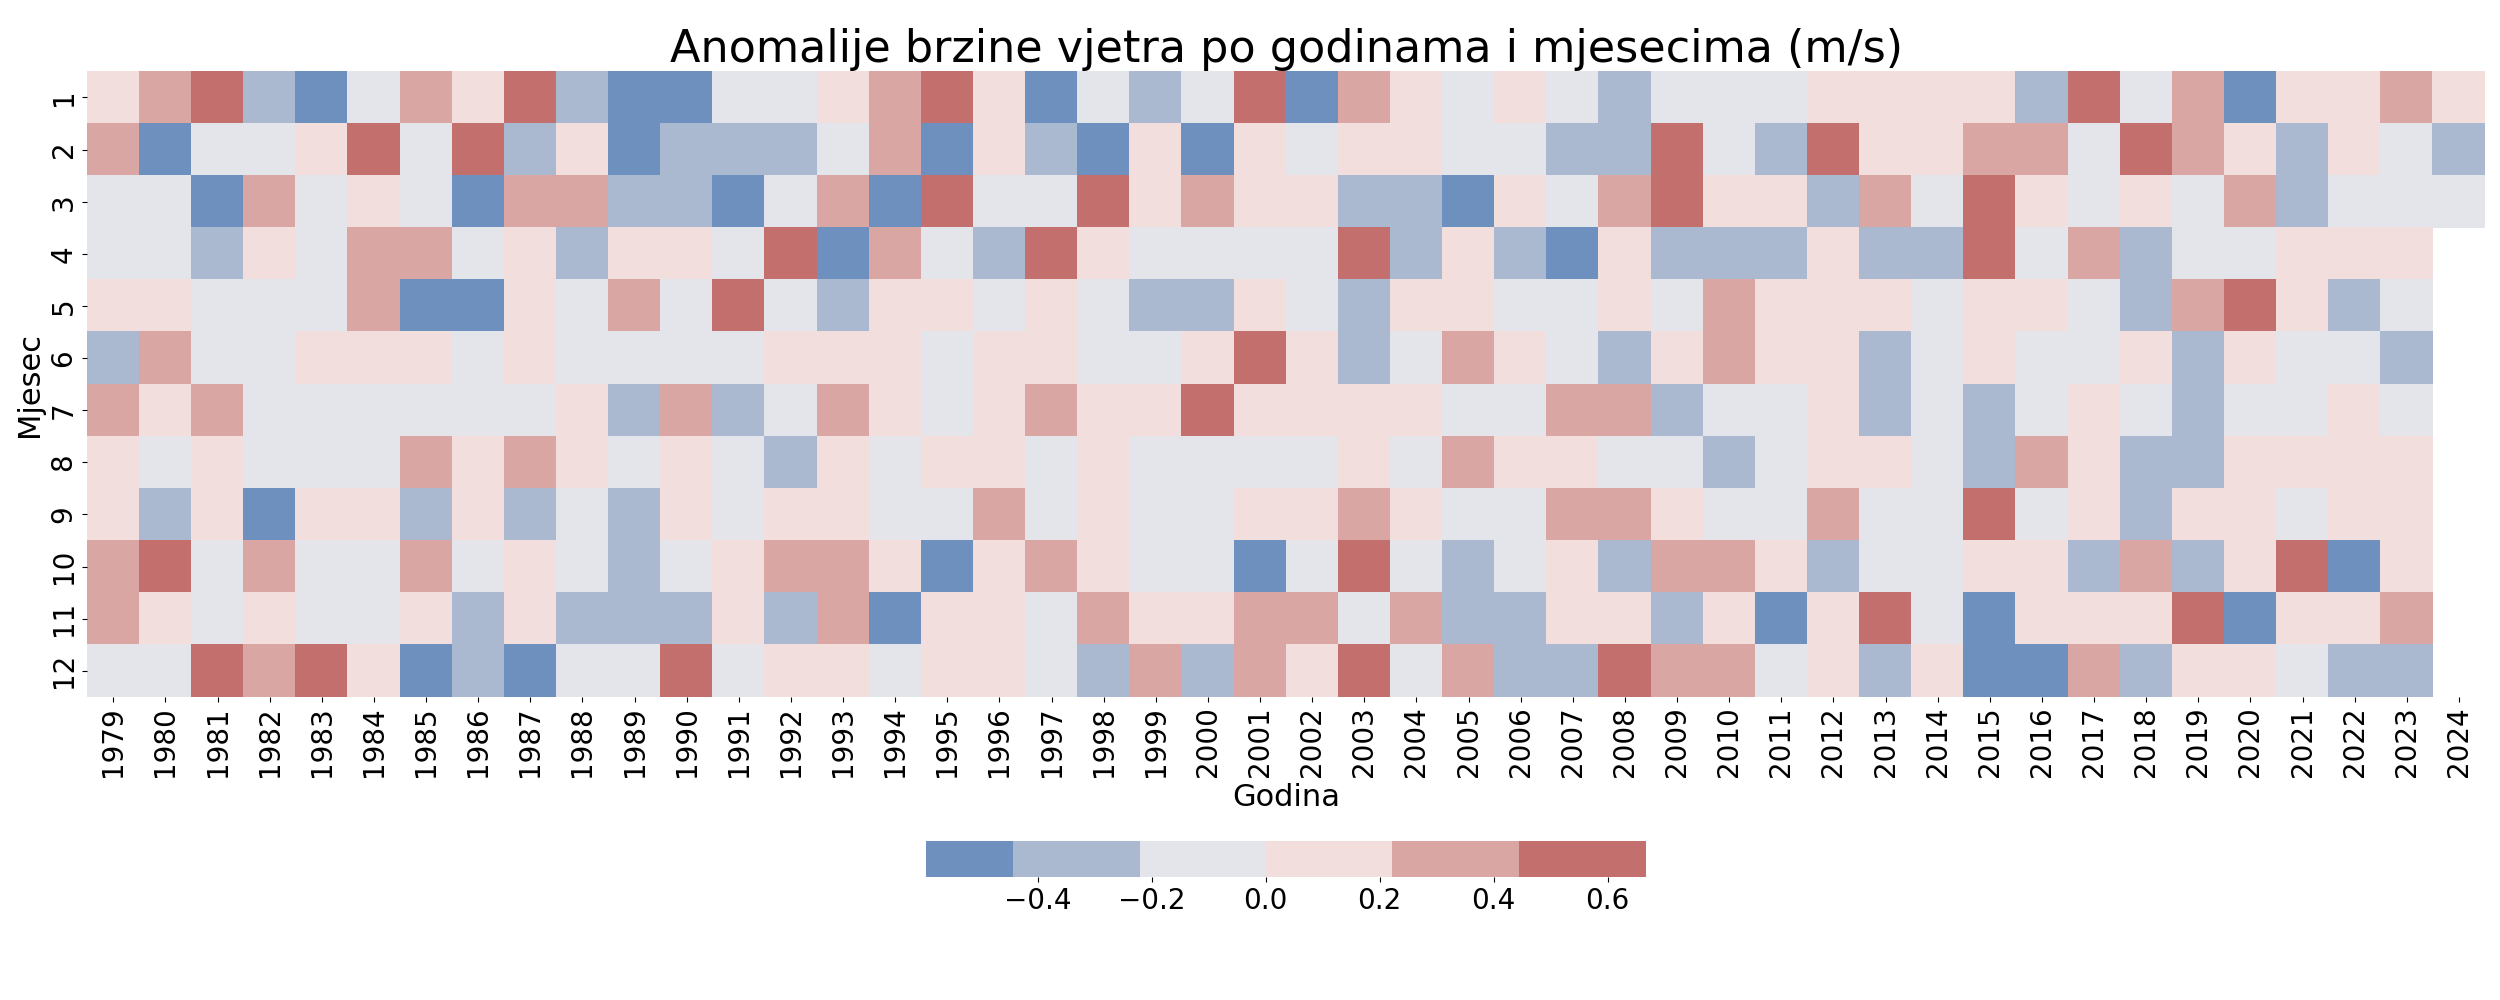
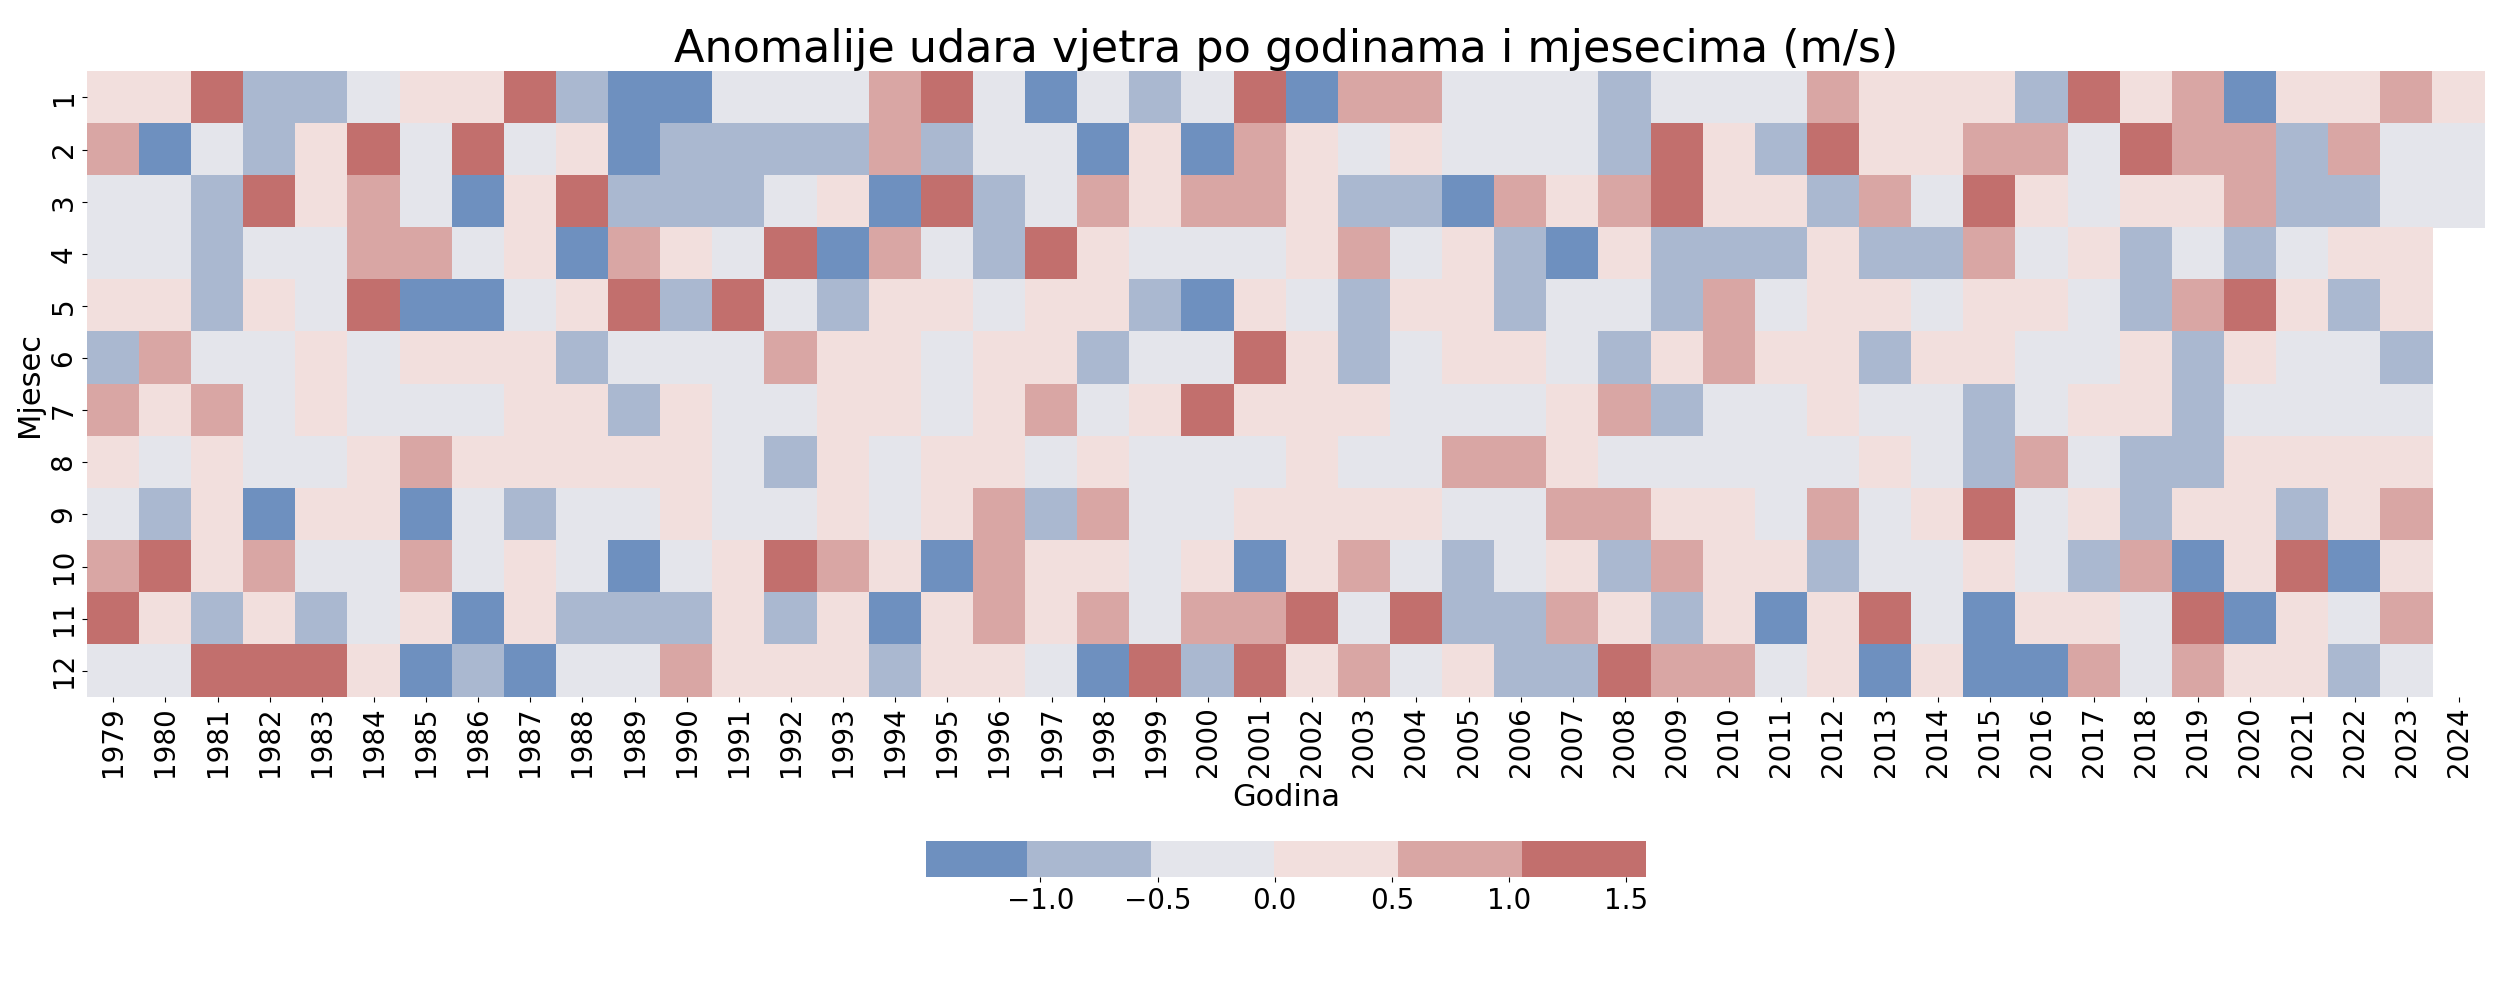
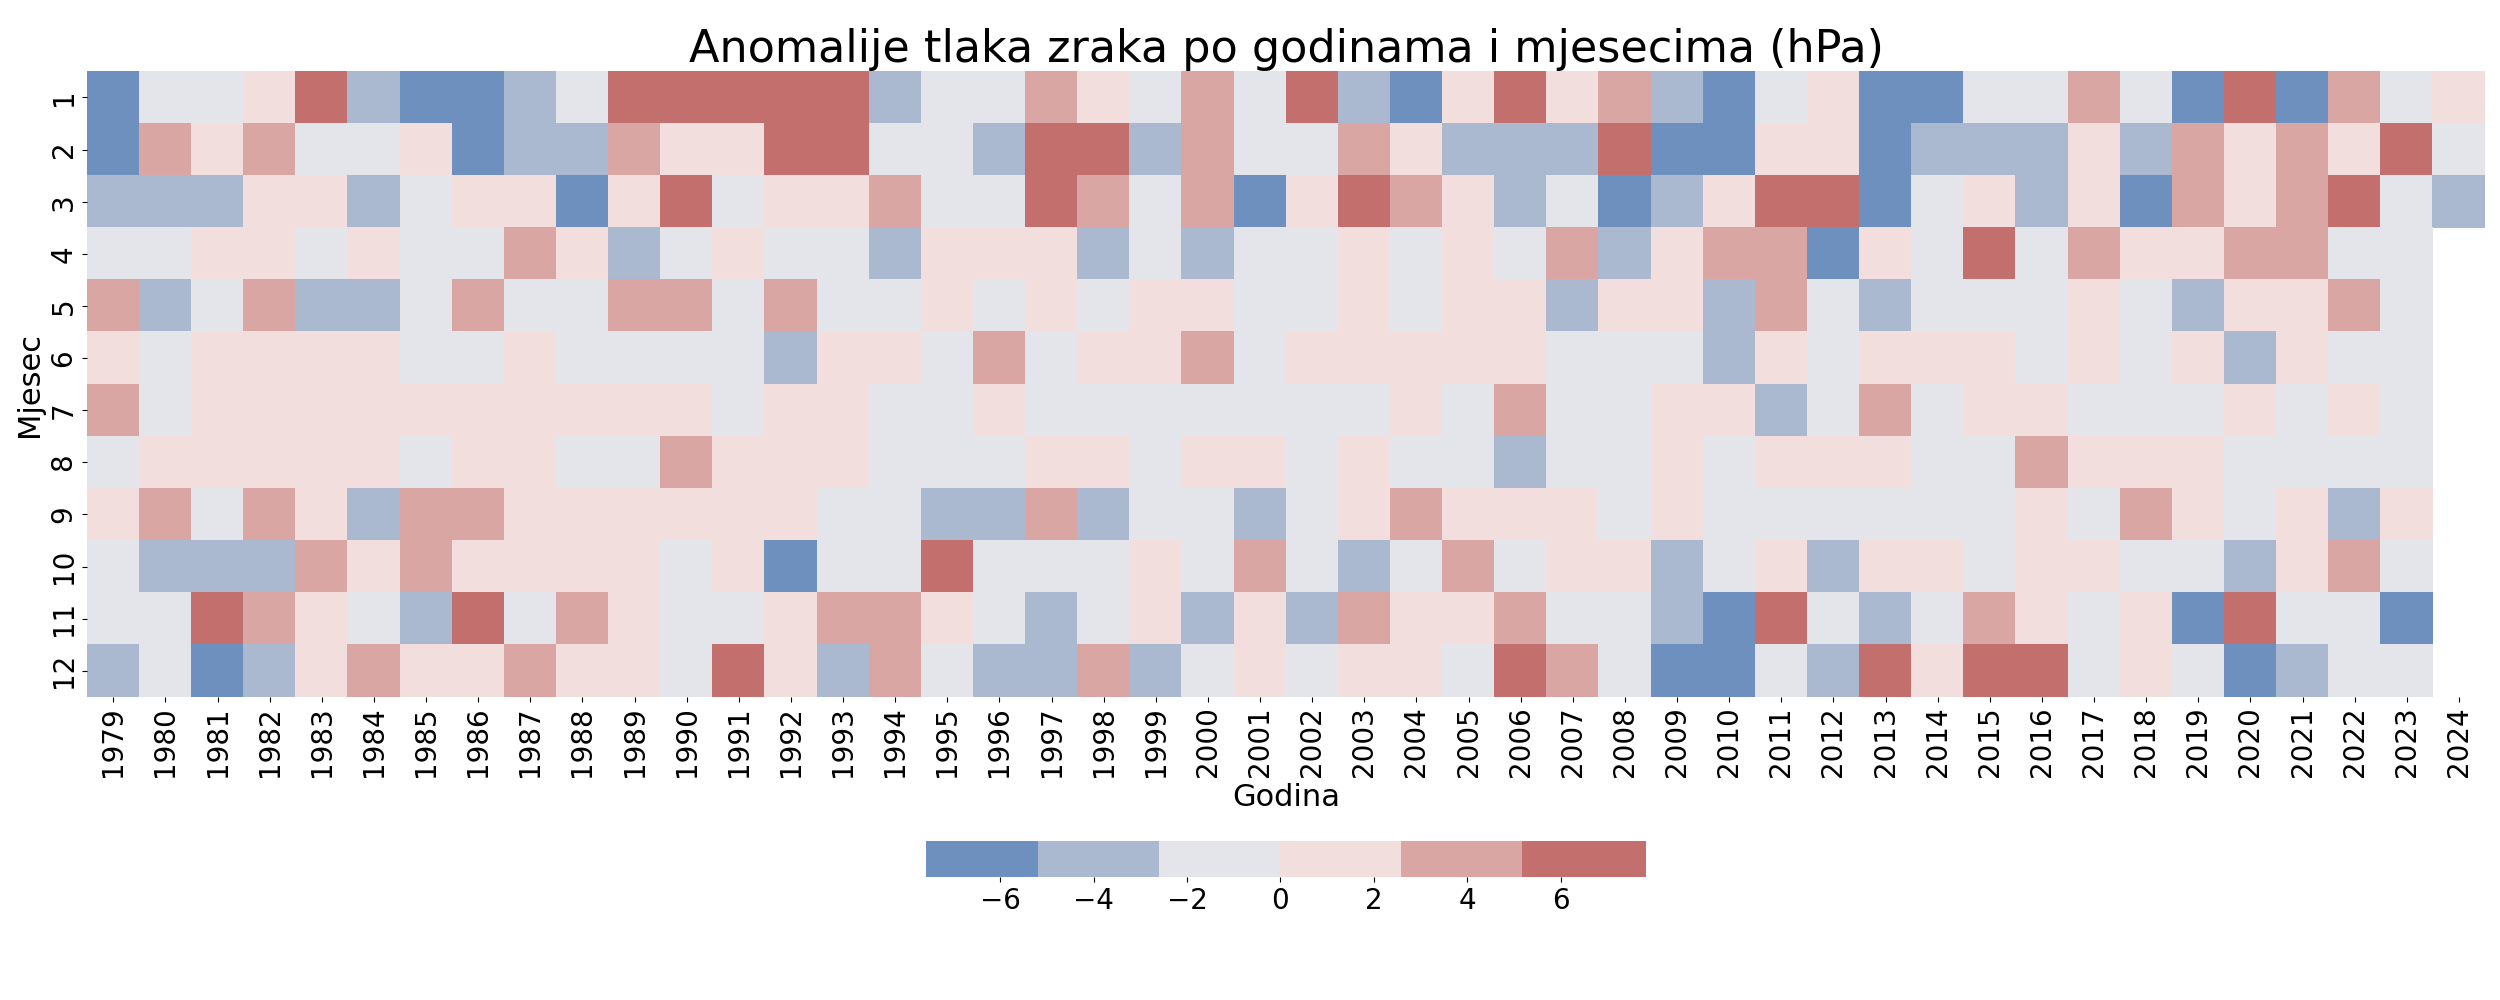
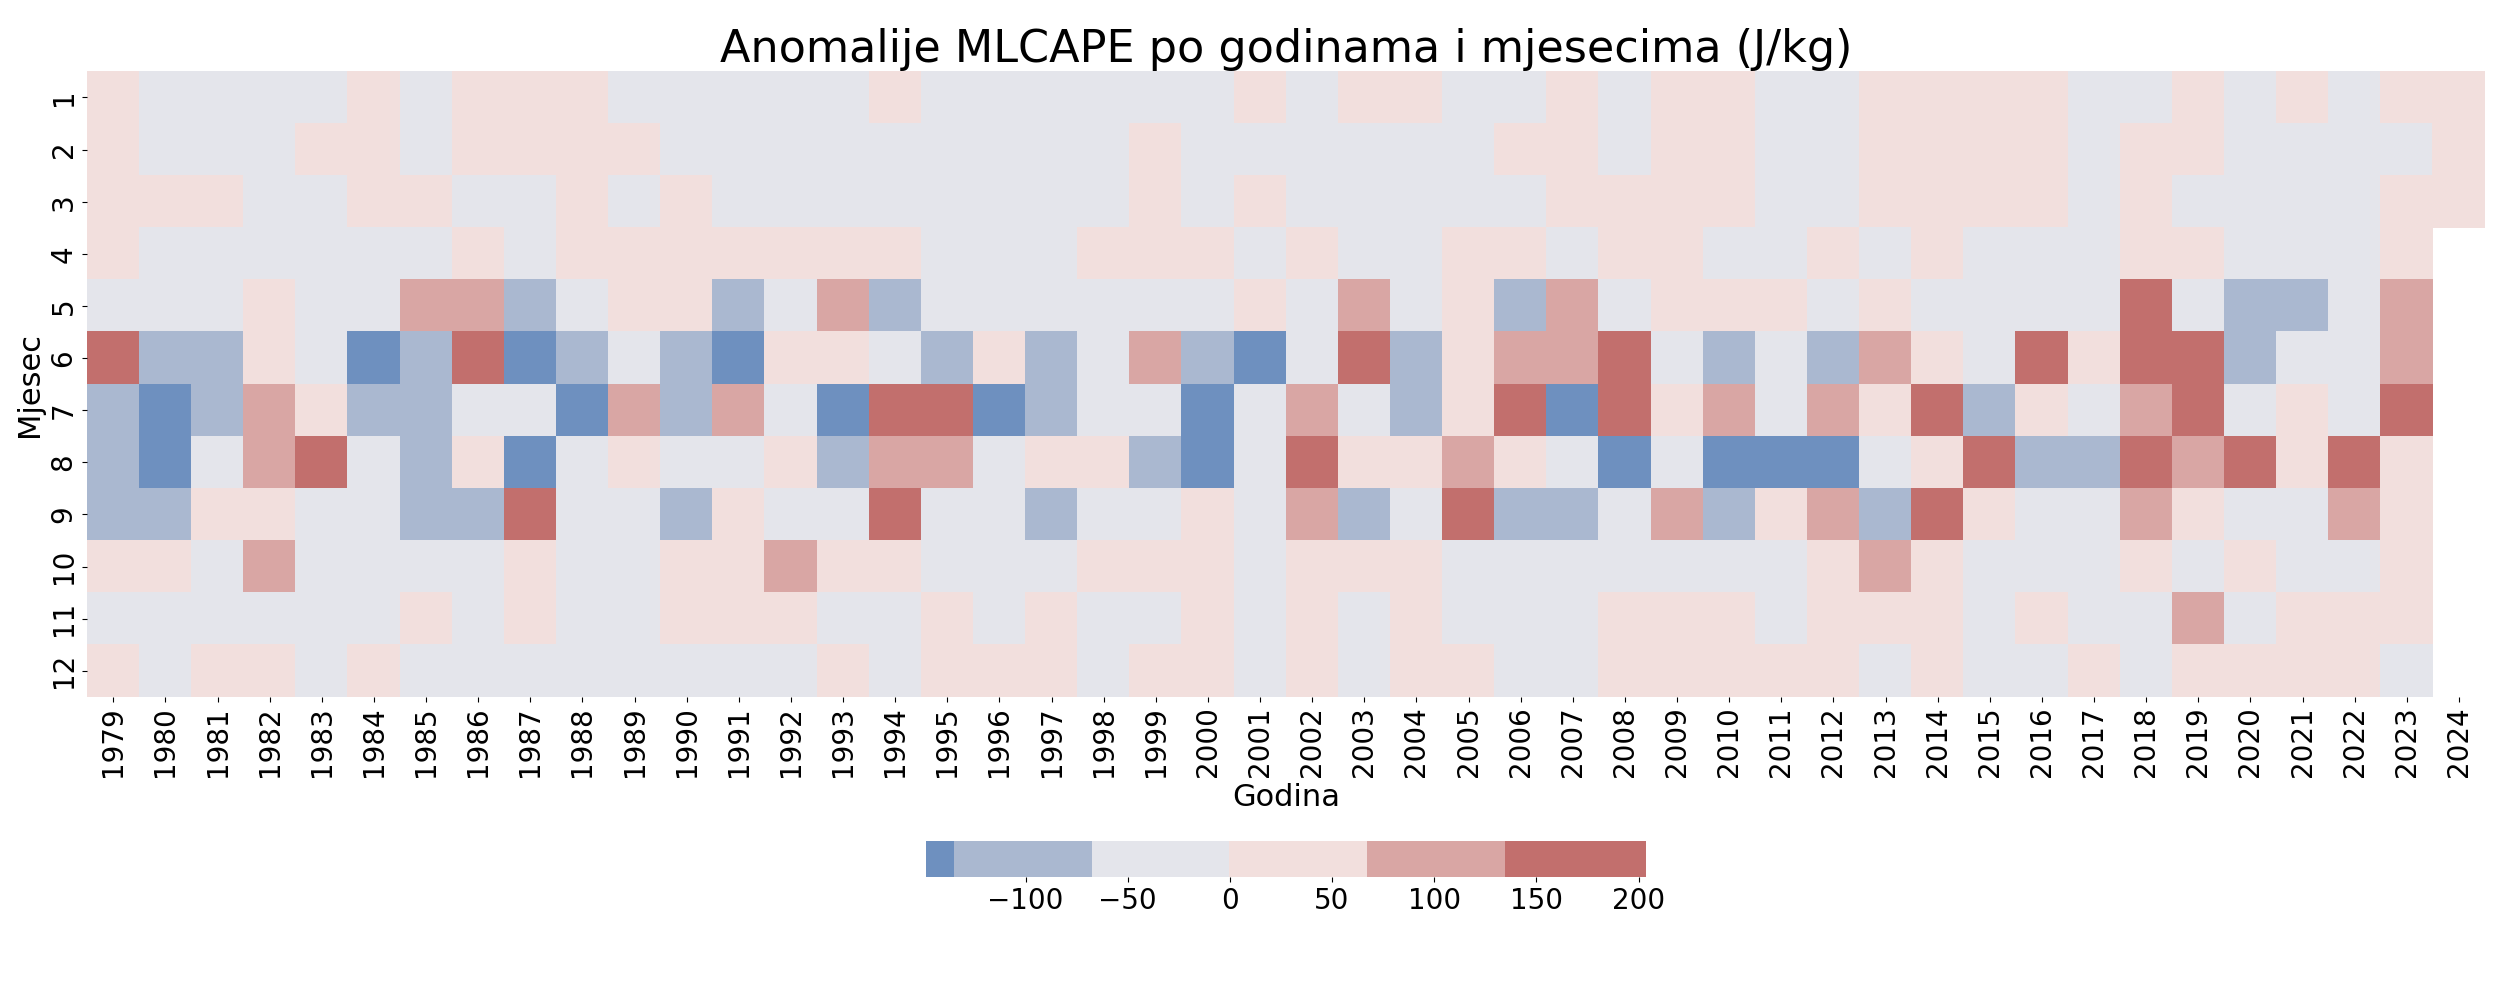
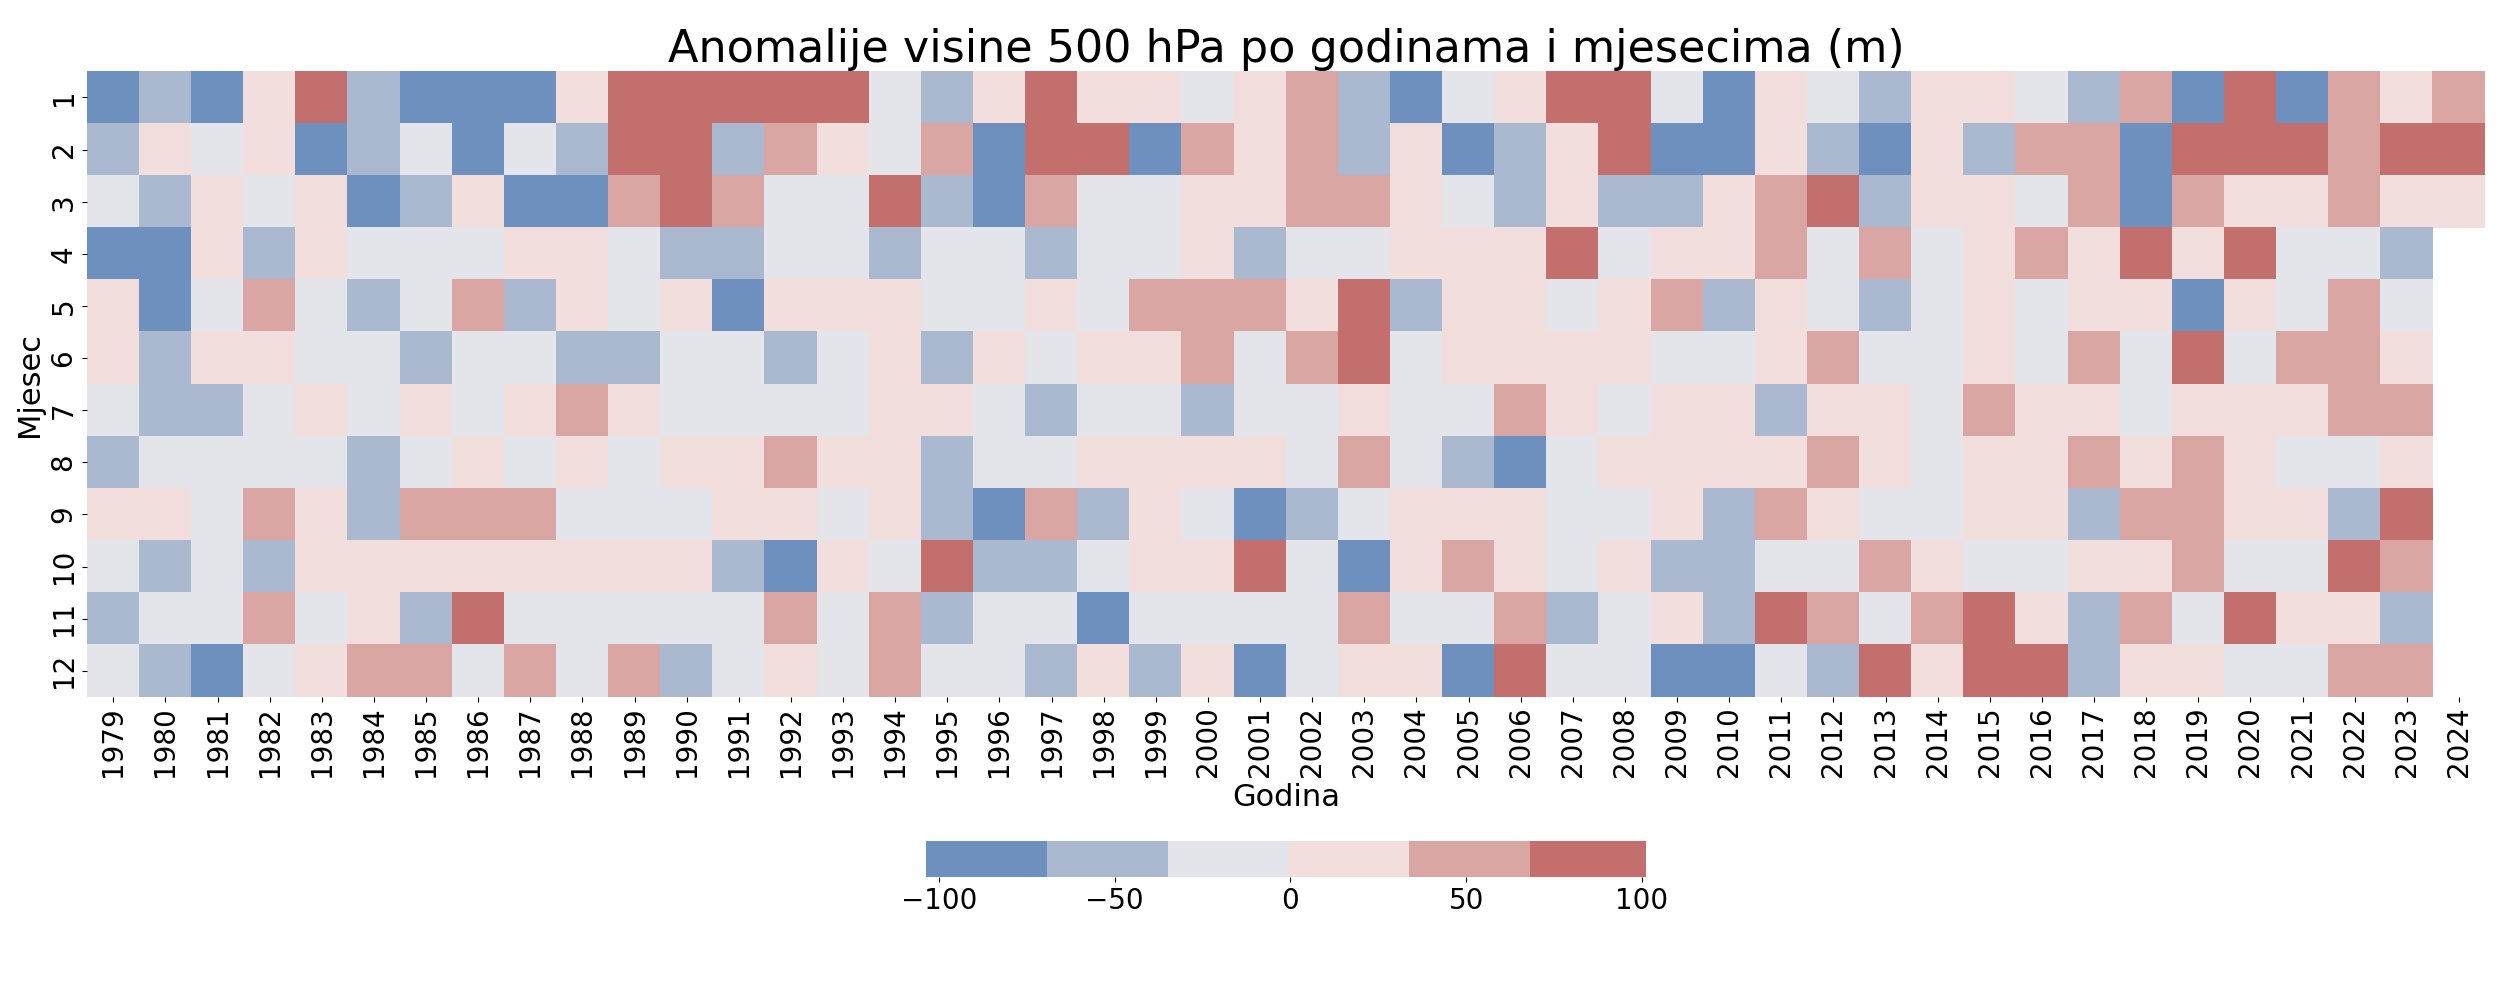
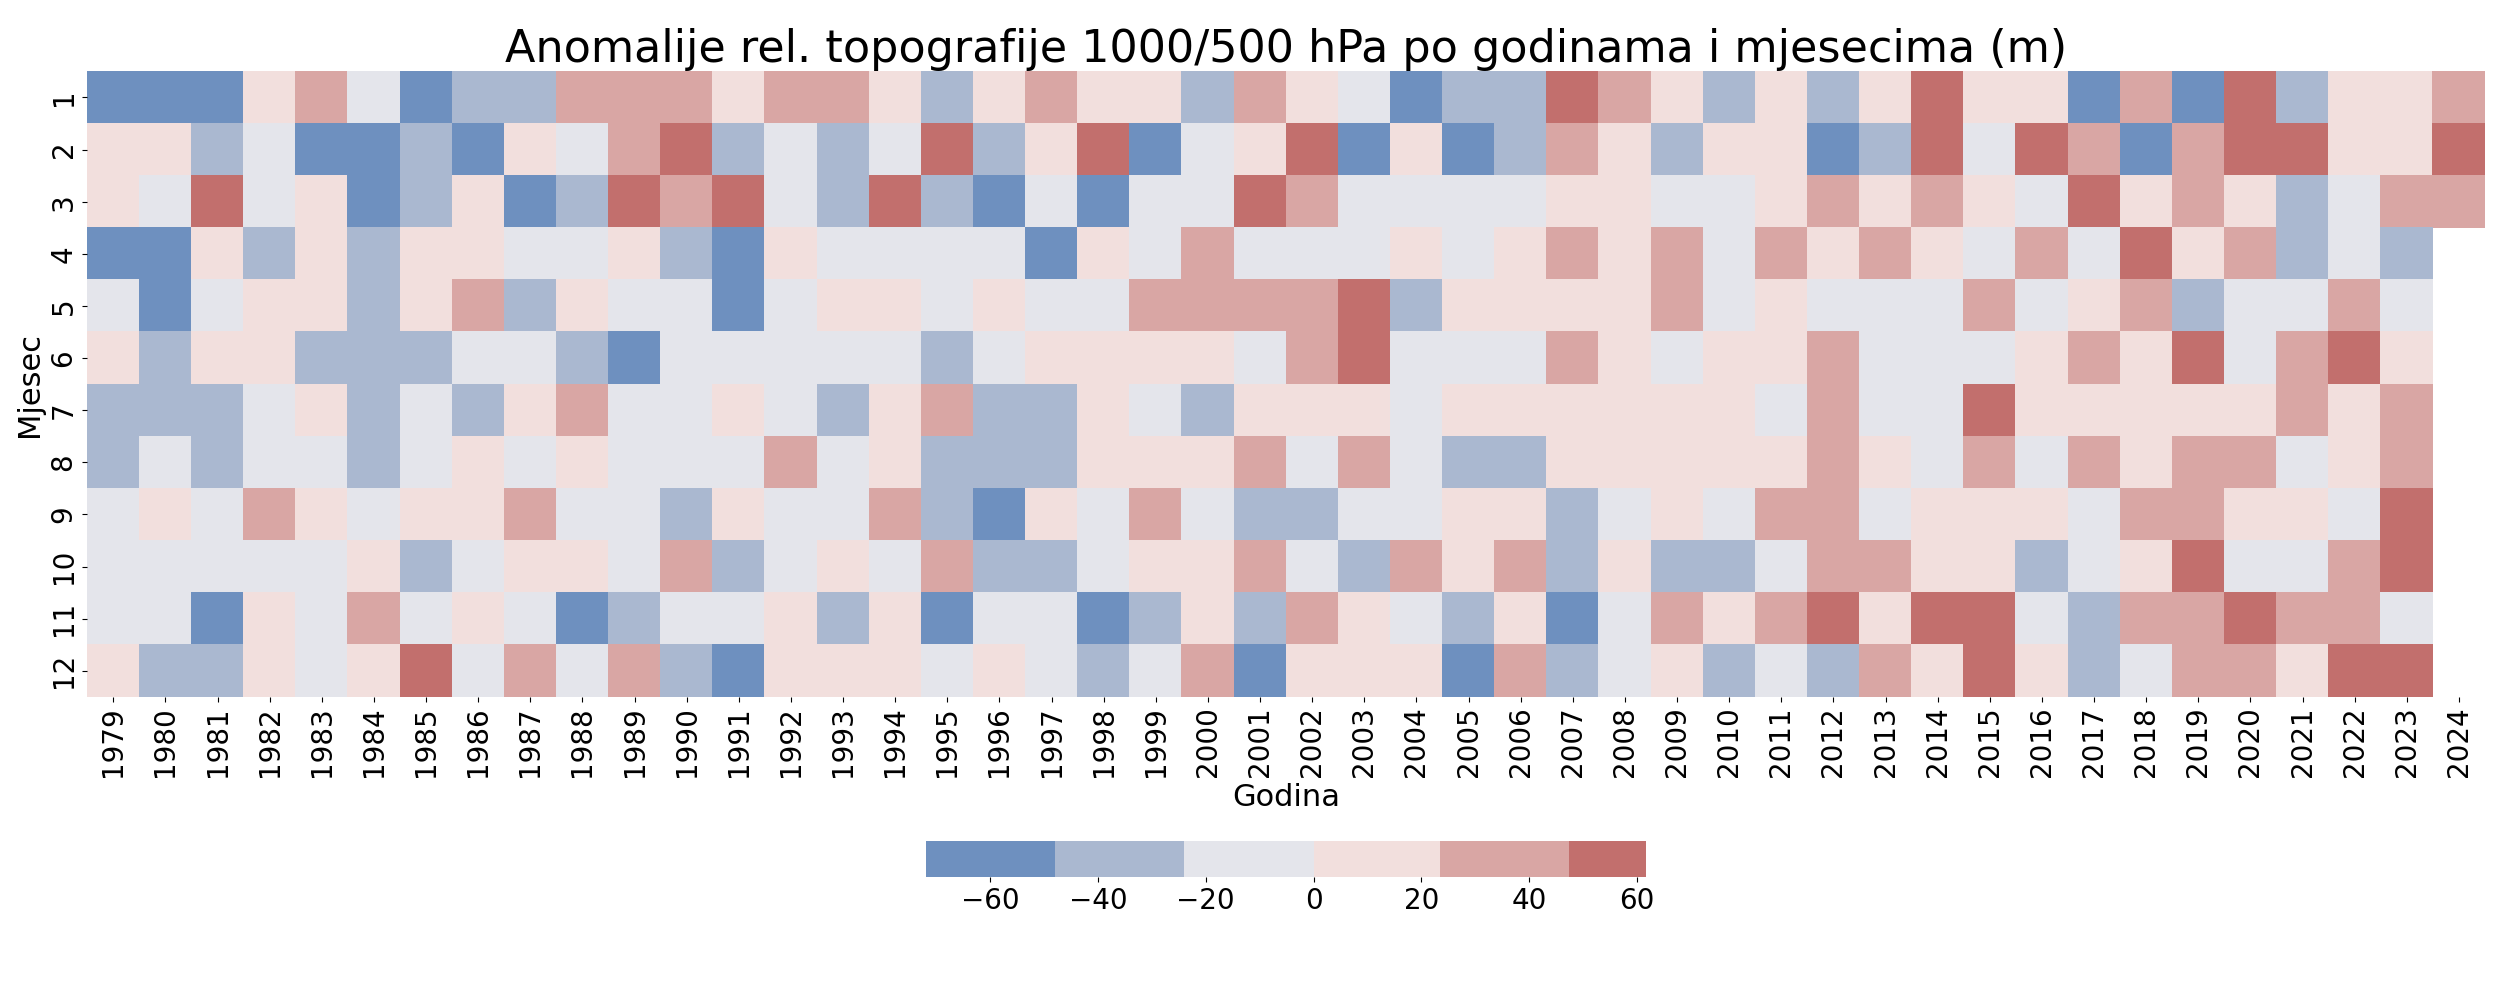
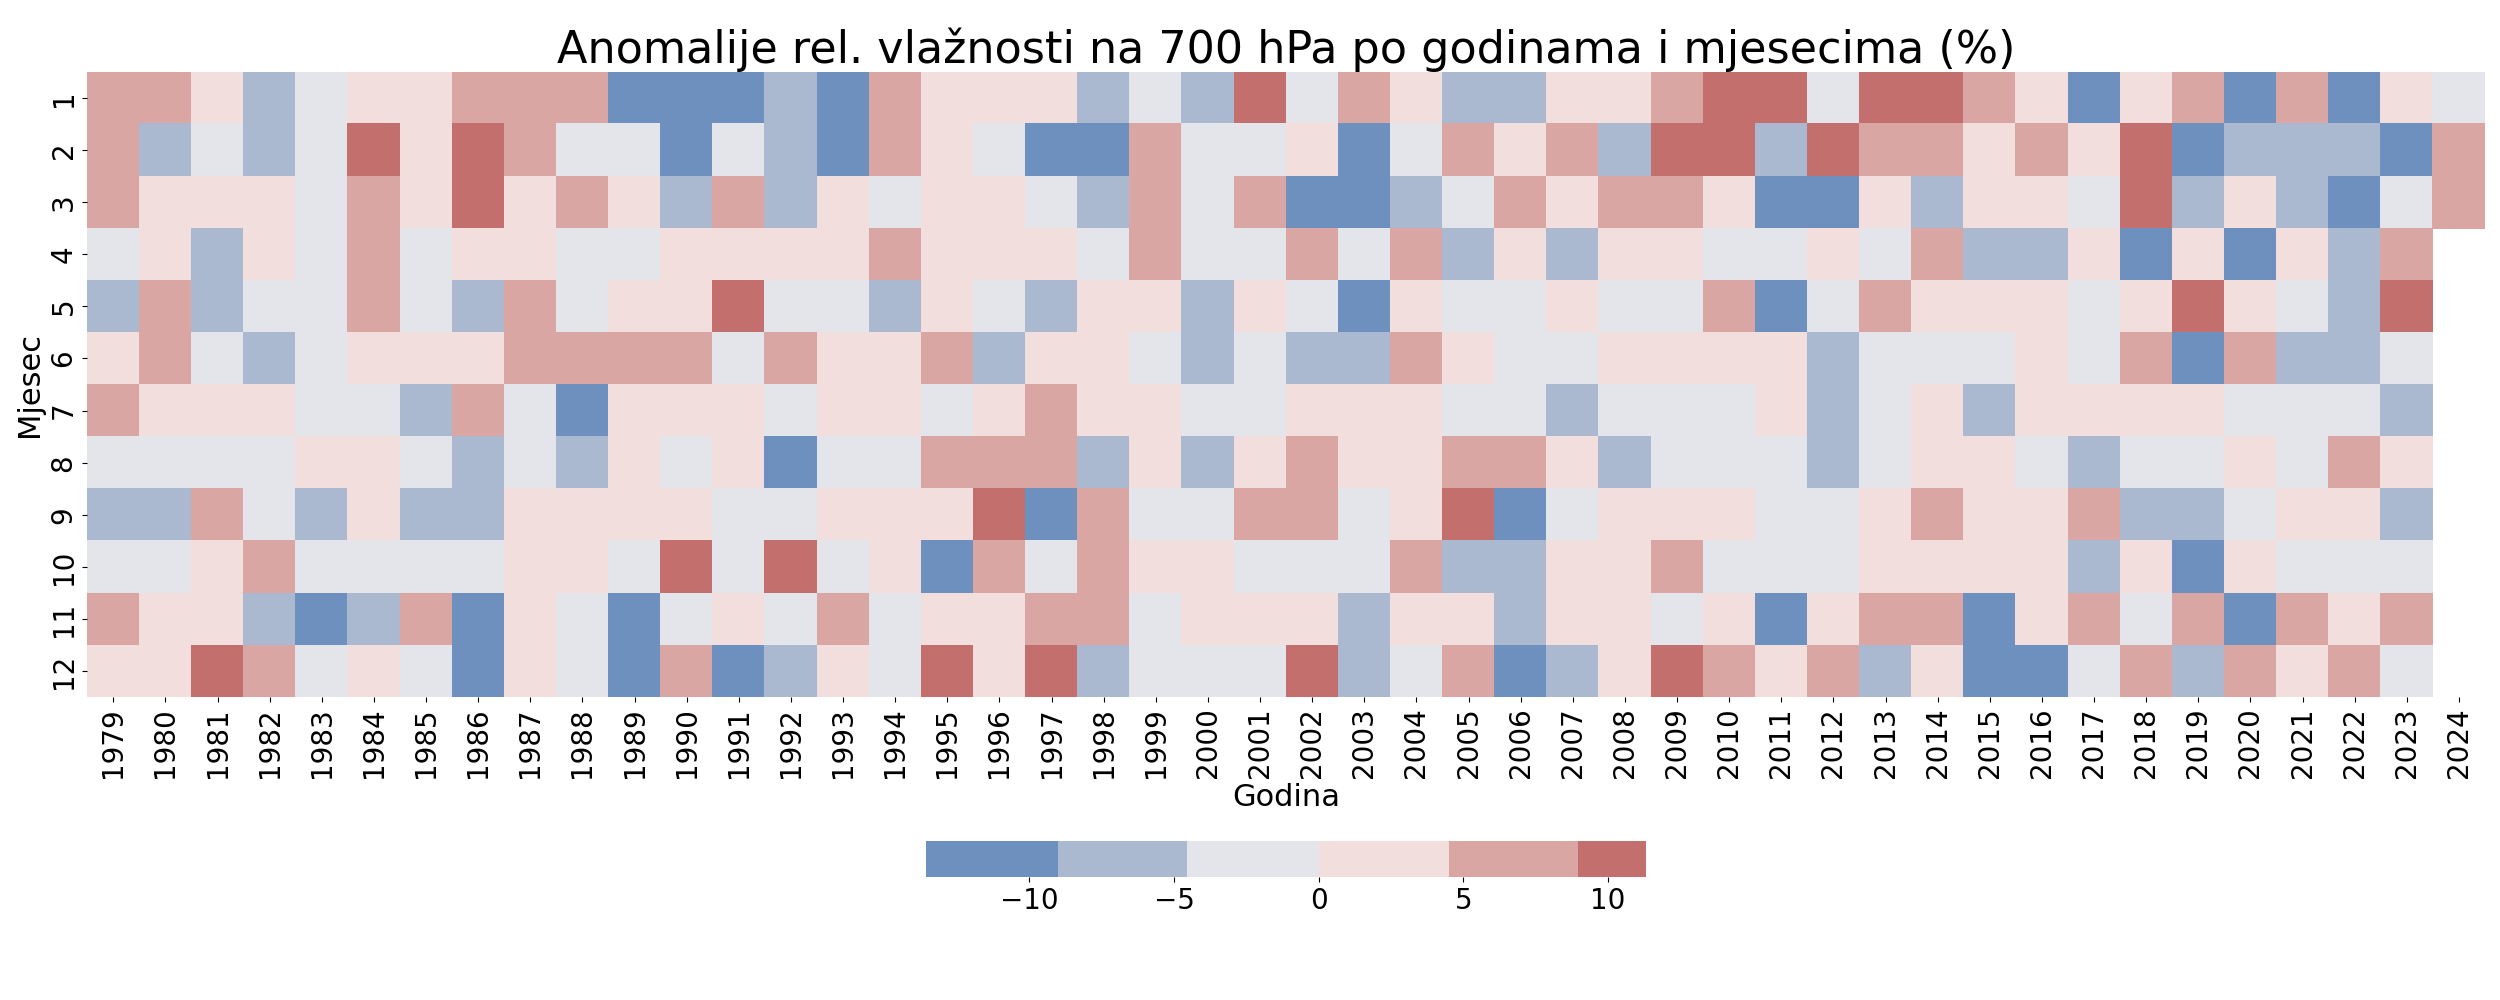
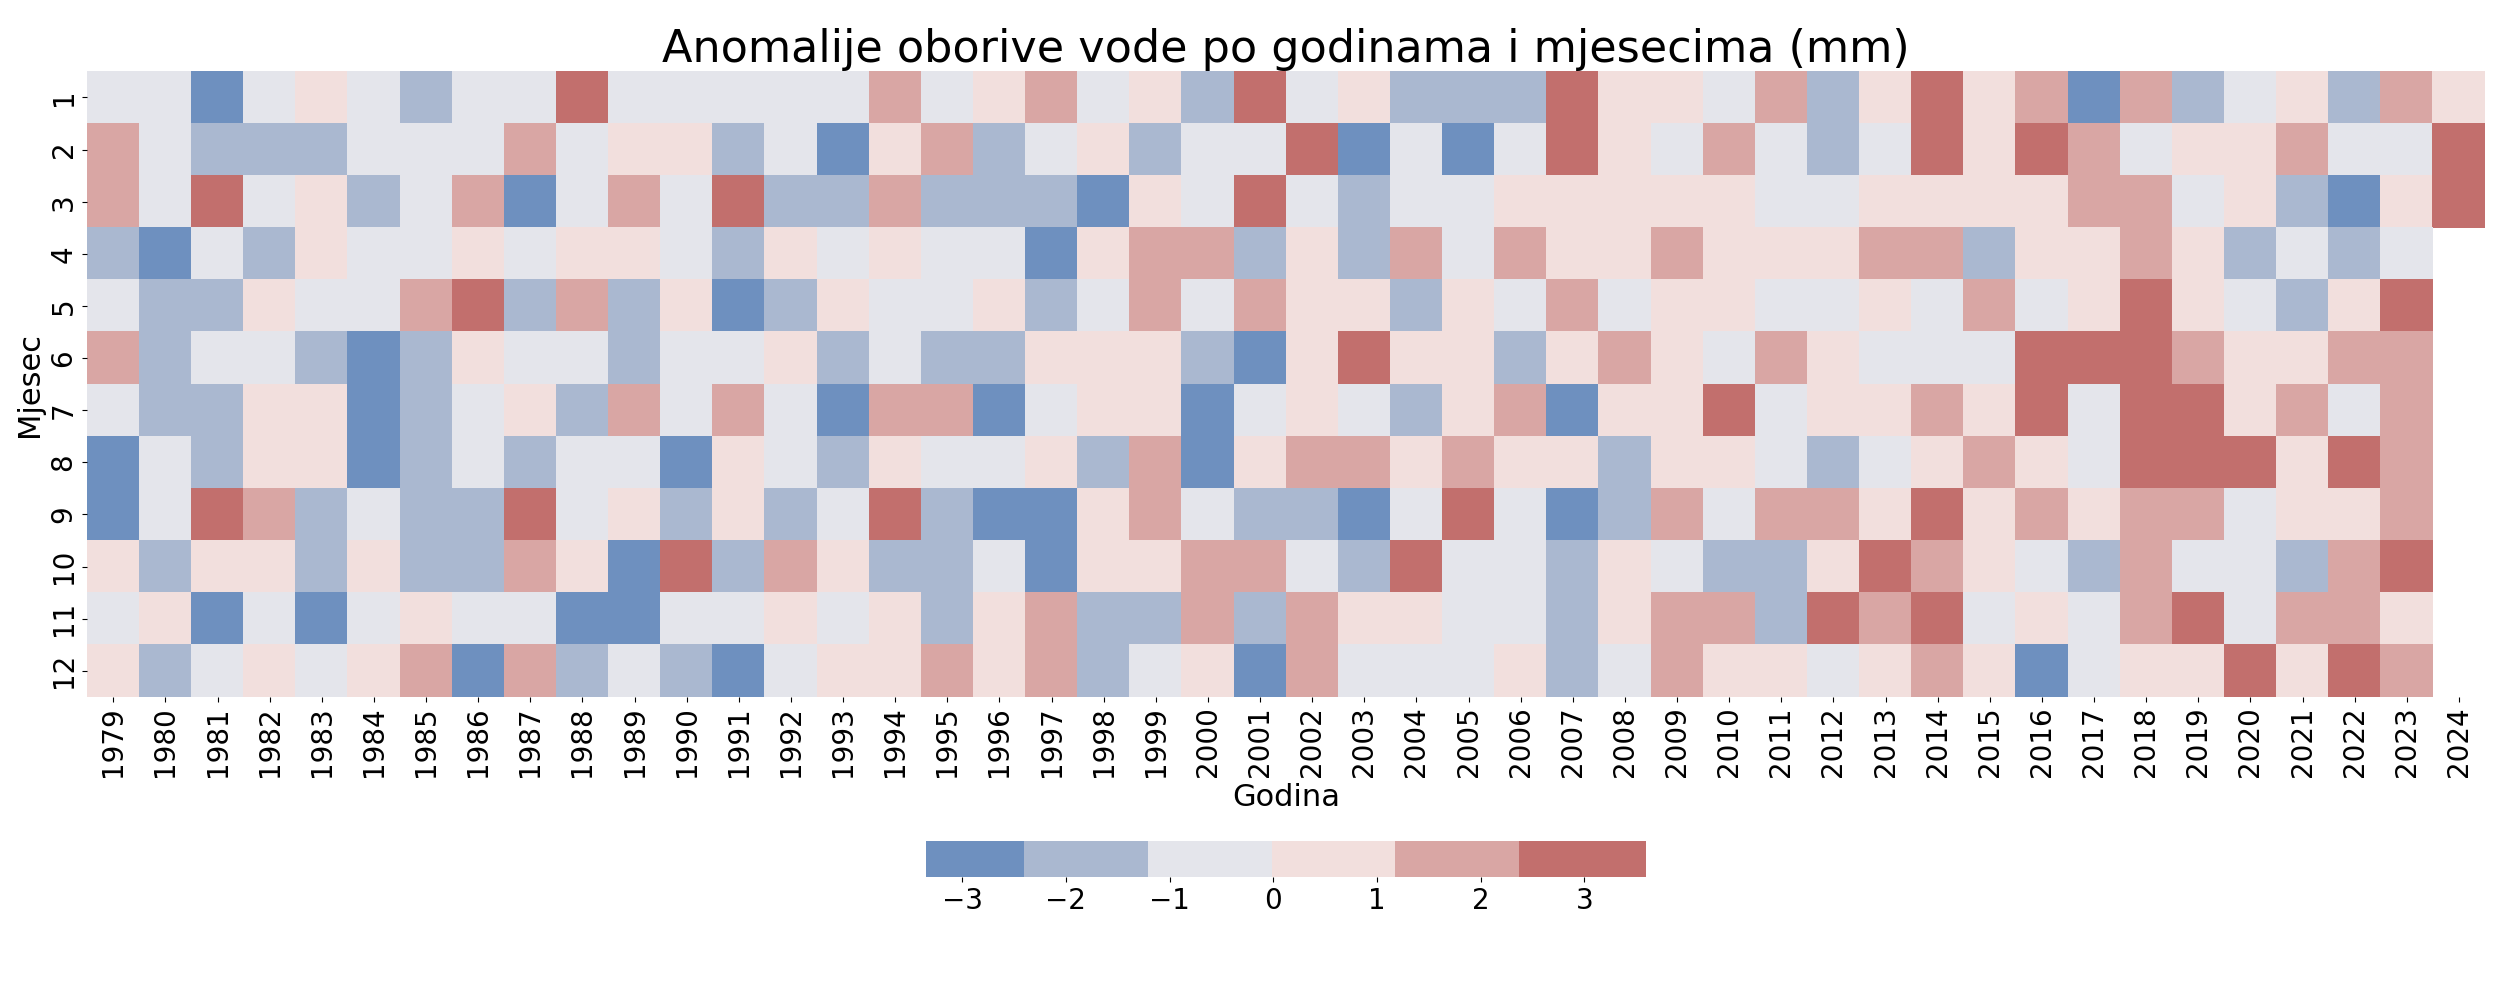
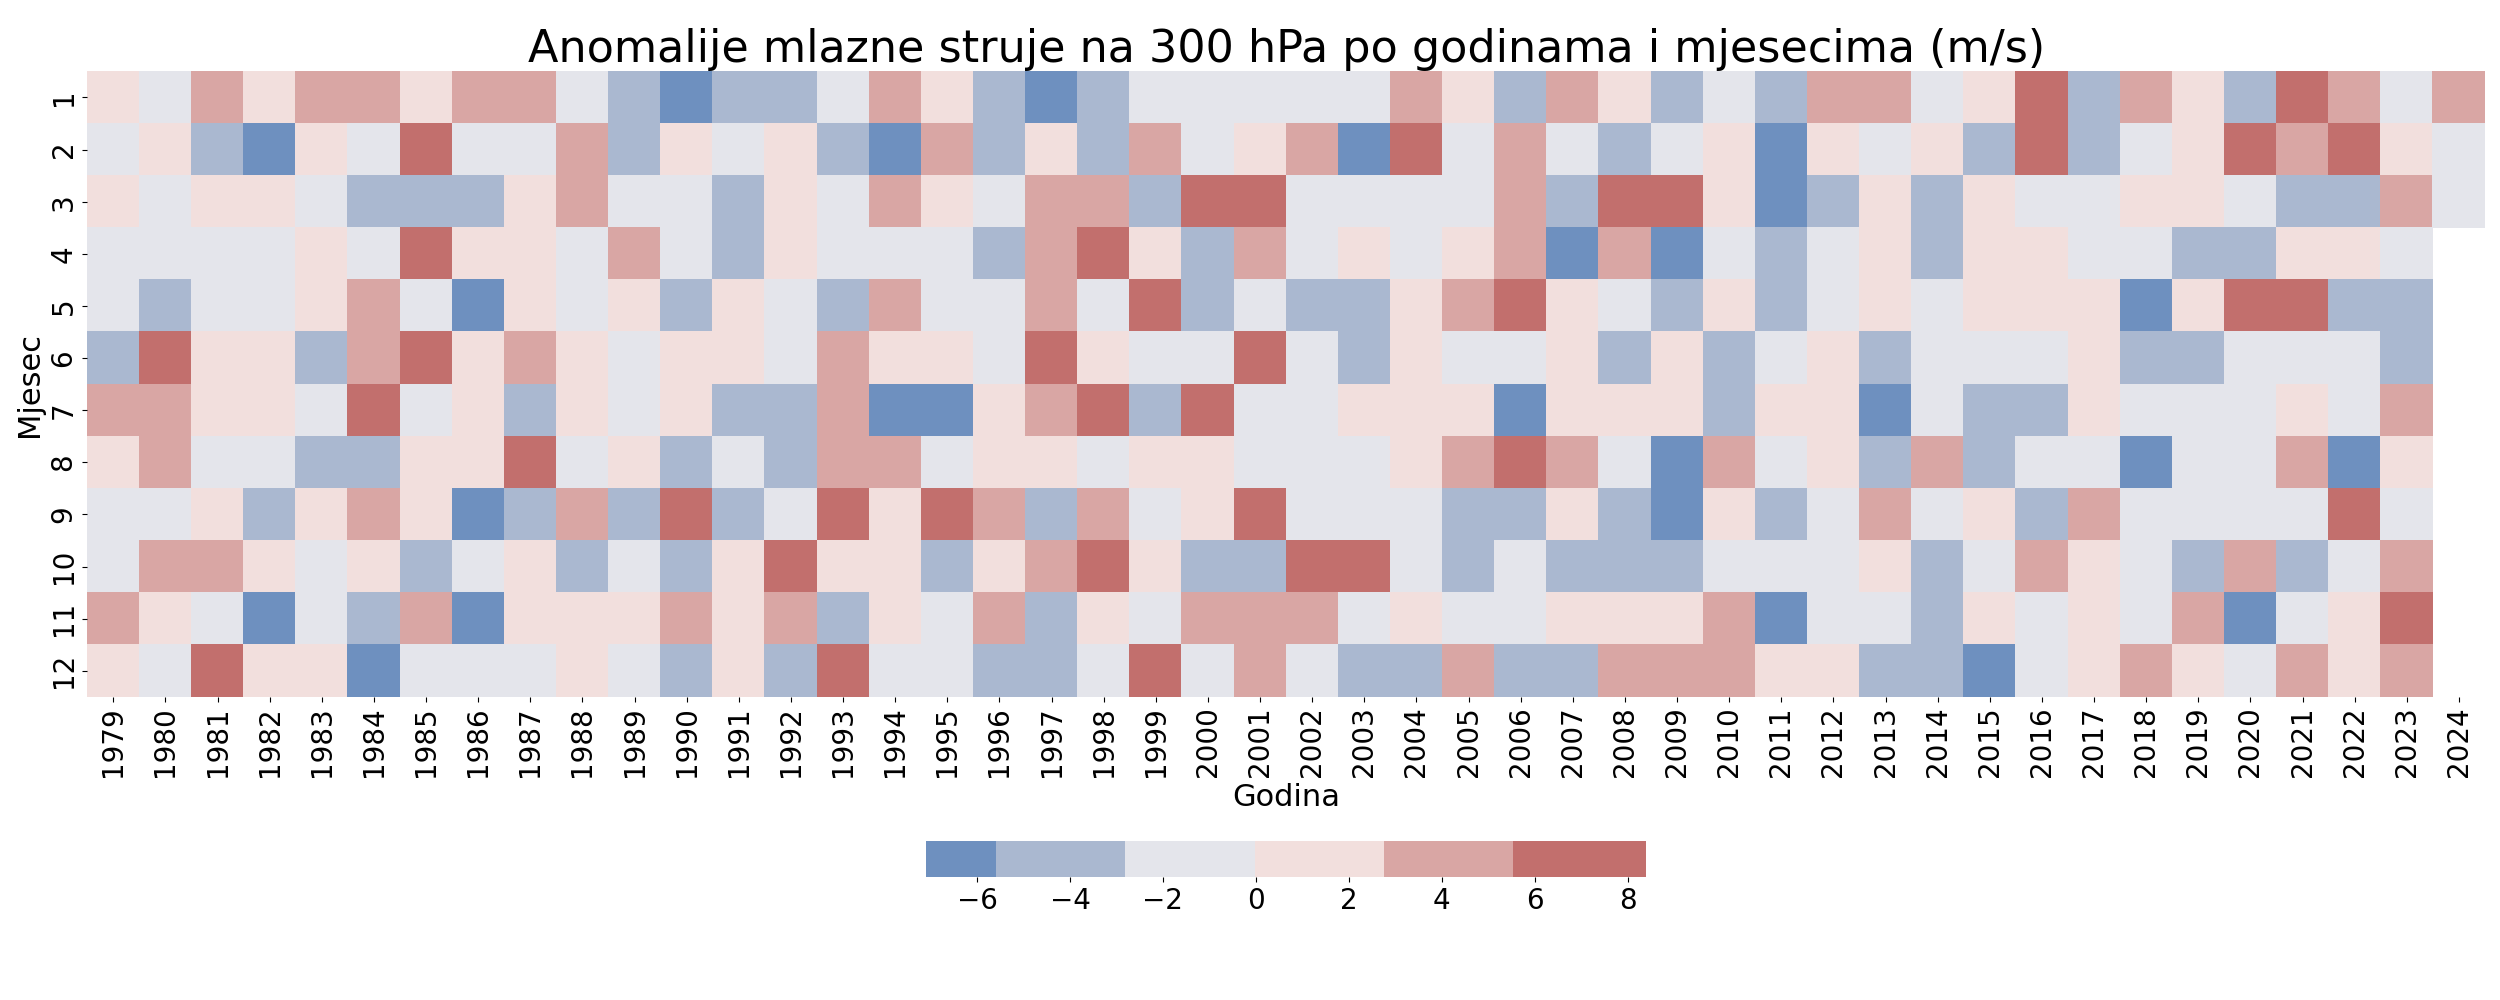
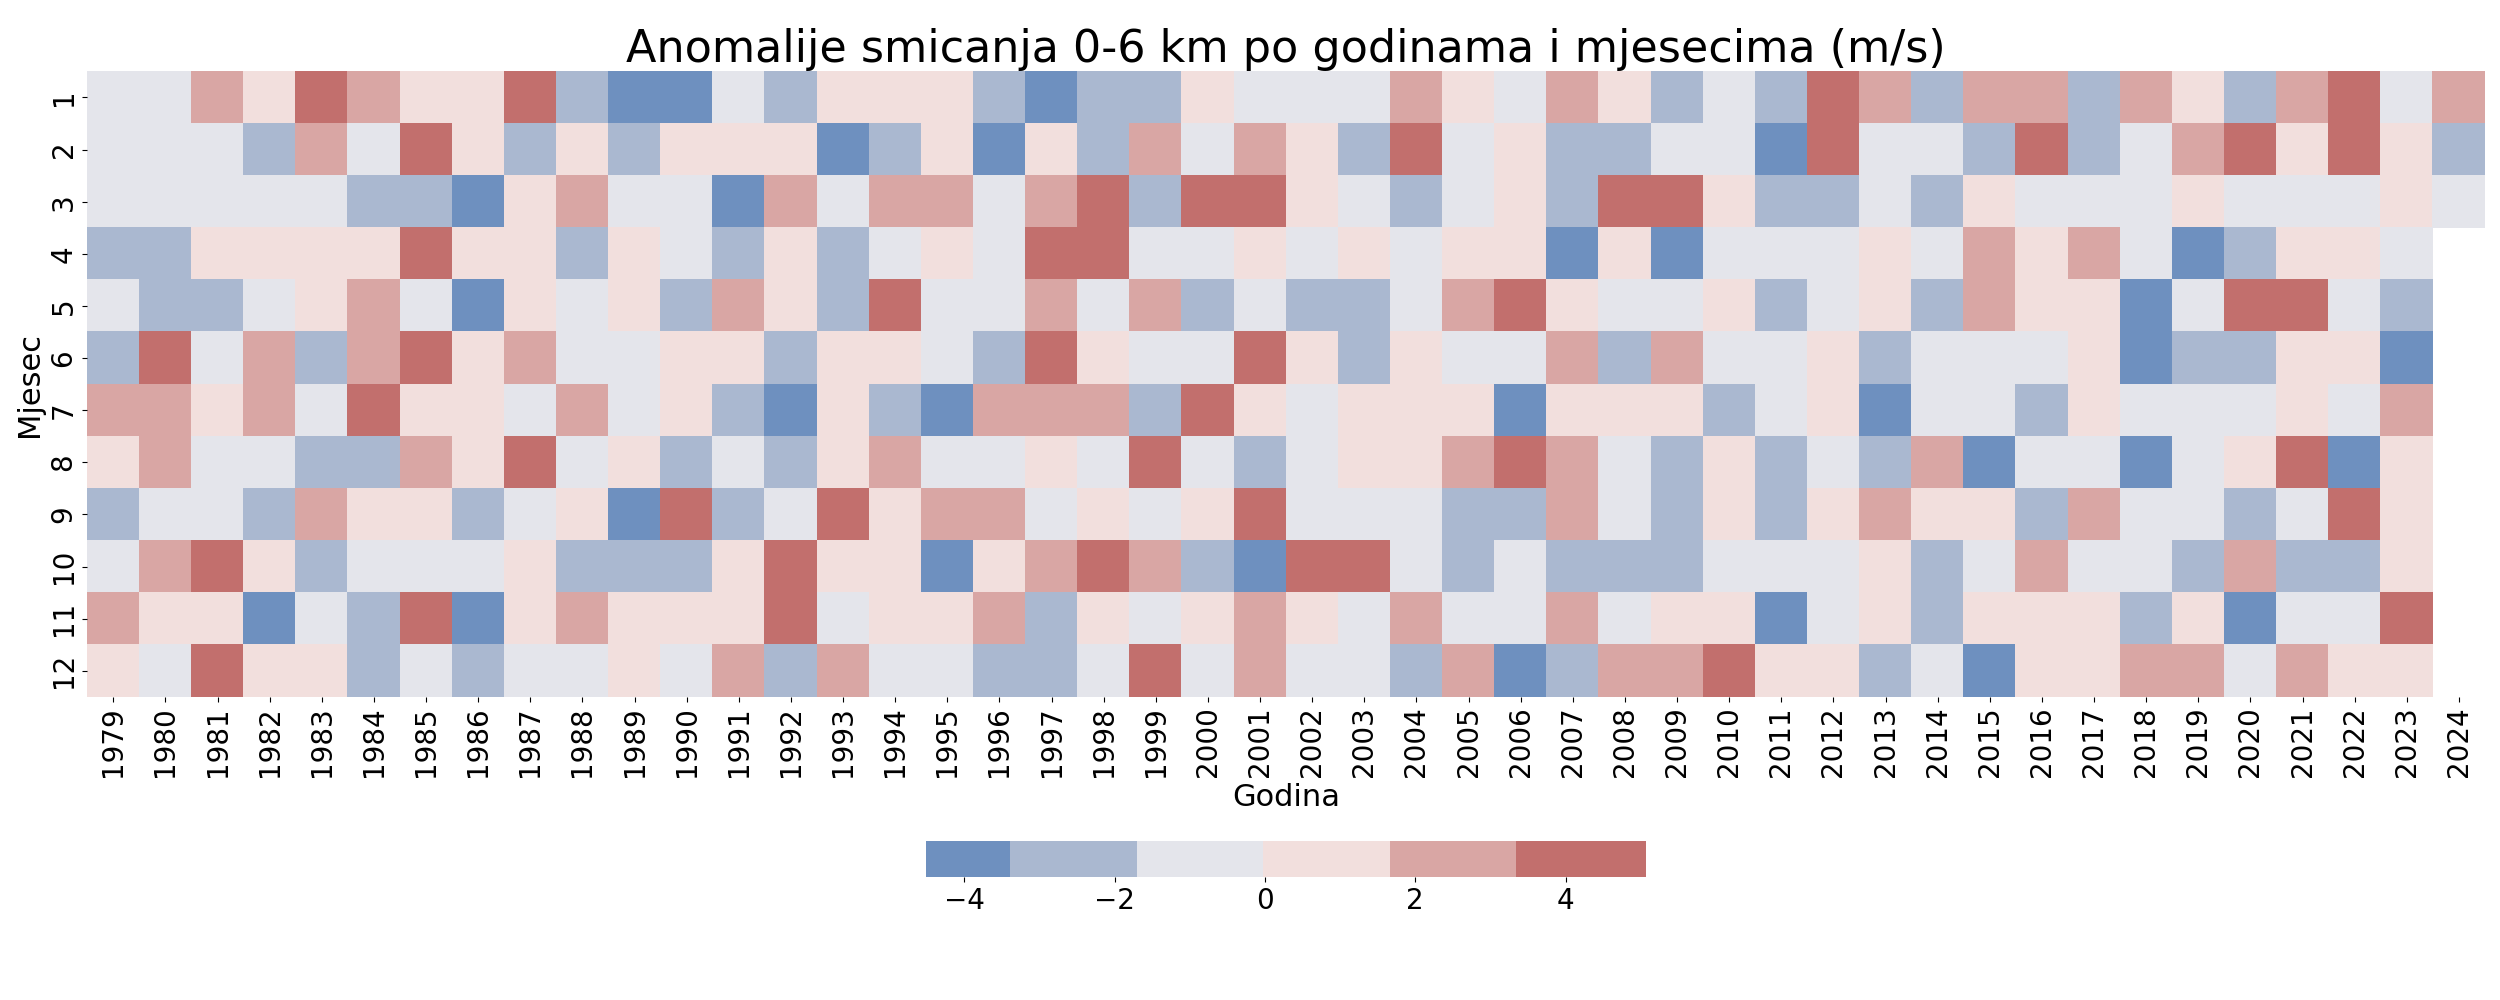
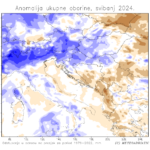
Na grafičkim prikazima u obliku “toplinskih mapa” (engl. heatmap) su plotirane mjesečne anomalije u regiji za 15 meteoroloških parametara. Za svaki parametar prikazuju se mjesečne anomalije od siječnja 1979. do kraja simuliranog perioda. Na y osi su naneseni mjeseci a na x osi godine. Sve prikazane anomalije odnose se srednju vrijednost podataka od 20 točaka koje odgovaraju odabranim urbanim lokacijama u regiji: Zagreb, Split, Rijeka, Osijek, Zadar, Pula, Karlovac, Slavonski Brod, Šibenik, Dubrovnik, Vis, Ljubljana, Sarajevo, Mostar, Beograd, Gospić, Delnice, Bari, Venecija i Graz. Sve pozitivne anomalije su prikazane crvenom bojom, a negativne plavom.
![](https://gamma.meteoadriatic.net/meteoadriatic/climate/TMP_2_heatmap.png)
![](https://gamma.meteoadriatic.net/meteoadriatic/climate/DPT_2_heatmap.png)
![](https://gamma.meteoadriatic.net/meteoadriatic/climate/RH_2_heatmap.png)
![](https://gamma.meteoadriatic.net/meteoadriatic/climate/precave_heatmap.png)
![](https://gamma.meteoadriatic.net/meteoadriatic/climate/cldave_heatmap.png)
![](https://gamma.meteoadriatic.net/meteoadriatic/climate/wspd_heatmap.png)
![](https://gamma.meteoadriatic.net/meteoadriatic/climate/GUST_SF_heatmap.png)
![](https://gamma.meteoadriatic.net/meteoadriatic/climate/MSLET_SF_heatmap.png)
![](https://gamma.meteoadriatic.net/meteoadriatic/climate/CAPE_180_heatmap.png)
![](https://gamma.meteoadriatic.net/meteoadriatic/climate/HGT_500_heatmap.png)
![](https://gamma.meteoadriatic.net/meteoadriatic/climate/RT_1000_500_heatmap.png)
![](https://gamma.meteoadriatic.net/meteoadriatic/climate/RH_700_heatmap.png)
![](https://gamma.meteoadriatic.net/meteoadriatic/climate/PWAT_CLM_heatmap.png)
![](https://gamma.meteoadriatic.net/meteoadriatic/climate/jet_heatmap.png)
![](https://gamma.meteoadriatic.net/meteoadriatic/climate/dls_heatmap.png)